Wednesday, December 31, 2008

2D Area-Length LV Mass Calculator

I much prefer the 'ellipse tool' to the default method of tracing borders with the trackball. Plus, it is quick, pretty, and is more consistent with the principle behind the calculation.


Notes:

  • Measure at end diastole (End diastole can be defined at the onset of the QRS, but is preferably defined as the frame after mitral valve closure or the frame in the cardiac cycle in which the cardiac dimension is largest.)
  • Measure areas at the midventricular short axis view, at the level of the papillary muscle tips- generally the widest short axis diameter.
  • Measure the LV length from apex to plane of MV annulus, in A4C or A2C (largest) It is recommended that the basal border of the LV cavity area be delineated by a straight line connecting the mitral valve insertions.
  • Z-Scores are 'off label' (source article used M-Mode derived LV mass)

Recommendations for Chamber Quantification, JASE, December 2005
Recommendations for Quantification of the Left Ventricle by Two-Dimensional Echocardiography, JASE, 1989
A novel method of expressing left ventricular mass relative to body size in children.
Foster BJ, Mackie AS, Mitsnefes M, Ali H, Mamber S, Colan SD.
Circulation. 2008 May 27;117(21):2769-75.

Sunday, December 14, 2008

New Coronary Artery Z-Score Calculator

The folks over at Children's National Medical Center, Washington, D.C. (CNMC) have fired up their digital echo database: in a four month period, they sorted through over 400 eligible normal echos, and served up the largest analysis of normal coronary artery dimensions to date.

Their approach to the data analysis included explorations of the independent variables of BSA and height (and height, raised to the 2.7 power). Analysis of the varying independent measures and relationships demonstrated that the "best fit" model was the exponential model using BSA, or what is also known as the allometric model. Landing on this manner of analysis is not just fortuitous happenstance- numerous other investigations have come to the same conclusion regarding the scaling of cardiovascular structures. It is interesting to note that other recently published z-score data landed on a unique and quite different model (nonlinear polynomial fit).

Considering their allometric model, the scaling exponents of each of the coronary arteries calculated in this analysis are quite similar, but are not identical. Also, the scaling exponents are all very near 0.4-- not 0.5 as might be predicted by the theory of dimensional consistency (linear measurement of the coronary artery scaled to body surface area, i.e., cm vs. cm2). Actually, this comes as no surprise, given that the true nature of the relationship is (probably) a complex cascade between lean body mass, cardiac output, wall tension, and LV mass. Imperfect estimations of BSA are only peripherally related to some of these factors. It makes me wonder what the relationship would look like if we scaled/standardized the coronary artery diameters to LV mass instead of BSA.

Comparing this data to prior work, the authors note a very close correlation with the data from Boston, and they very politely admit some similarities to the data from Singapore (although, to be fair to the Singapore analysis it should be noted that they sought to make an internally standardized reference- indexing to the aorta- and thus their treatment of the relationship to BSA is not very robust). The authors have already done their own "smackdown" and their graphic comparison of the CNMC and Boston data is unsurprising. Moreover, the models and scaling exponents are remarkably similar. Here are the two LMCA prediction equations:

CNMC*:

 eqn8614

Boston:

 eqn8613 


* note: the CNMC equation is the alternate/equivalent form of their published equation: ln(M) = beta1 + beta2 x  ln(BSA)

If we discount the Boston y-intercept of -0.02887, as being so small as to be very nearly zero ( or, "not significantly different from zero"), the equations become all the more similar. We are then left with the primary difference between the z-score predictions being: the manner in which they deal with variance. The Boston group attempts to predict the standard deviation by a second regression equation, and the CNMC group takes the approach, now currently in vogue, of substituting the regression RMSE as the SD. The validity of either approach could(should?) probably be debated…

In the words of the authors:

Having a readily available Z-score calculator will be invaluable

Give it a go at ParameterZ.com.

I admit to taking a few liberties with this calculator: I convert the measurements to mm; I use the Haycock BSA formula rather than DuBois & DuBois (can't we just agree to do this already?); I use the 5th and 95th percentiles (± 1.65 SD's) for the limits on the range of normal values.


Coronary Artery Z Score Regression Equations and Calculators Derived From a Large Heterogeneous Population of Children Undergoing Echocardiography.
Laura Olivieri, Bob Arling, Mark Friberg, Craig Sable. Journal of the American Society of Echocardiography December 2008 (Article in Press DOI: 10.1016/j.echo.2008.11.003)
Theoretical and empirical derivation of cardiovascular allometric relationships in children.
Sluysmans T, Colan SD. J Appl Physiol. 2005 Aug;99(2):445-57. Epub 2004 Nov 19.
Allometric analysis of the association between cardiac dimensions and body size variables in 464 junior athletes.
George K, Sharma S, Batterham A, Whyte G, McKenna W. Clin Sci (Lond). 2001 Jan;100(1):47-54.
Derivation of a size-independent variable for scaling of cardiac dimensions in a normal adult population.
Neilan TG, Pradhan AD, Weyman AE. J Am Soc Echocardiogr. 2008 Jul;21(7):779-85. Epub 2008 Mar 10.
Does size matter? Clinical applications of scaling cardiac size and function for body size.
Dewey FE, Rosenthal D, Murphy DJ Jr, Froelicher VF, Ashley EA. Circulation. 2008 Apr 29;117(17):2279-87. Review.
Regression Equations for Calculation of Z Scores of Cardiac Structures in a Large Cohort of Healthy Infants, Children, and Adolescents: An Echocardiographic Study.
Pettersen MD, Du W, Skeens ME, Humes RA. J Am Soc Echocardiogr. 2008 Aug;21(8):922-34. Epub 2008 Apr 11.
A Novel Method of Expressing Left Ventricular Mass Relative to Body Size in Children.
Foster BJ, Mackie AS, Mitsnefes M, Ali H, Mamber S, Colan SD. Circulation. 2008 May 27;117(21):2769-75. Epub 2008 May 19.
Coronary artery involvement in children with Kawasaki disease: risk factors from analysis of serial normalized measurements.
McCrindle BW, Li JS, Minich LL, Colan SD, Atz AM, Takahashi M, Vetter VL, Gersony WM, Mitchell PD, Newburger JW; Pediatric Heart Network Investigators.
Circulation. 2007 Jul 10;116(2):174-9. Epub 2007 Jun 18.
Coronary normograms and the coronary-aorta index: objective determinants of coronary artery dilatation.
Tan TH, Wong KY, Cheng TK, Heng JT. Pediatr Cardiol. 2003 Jul-Aug;24(4):328-35. Epub 2002 Sep 25.

Sunday, December 7, 2008

Ascending Aorta Z-Score Calculator

A z-score calculator for the ascending aorta (AAO), based on this article, is now available at ParameterZ.

The source article is relatively recent (2006) and confirms my own experience: z-score data for the ascending aorta are hard to find.

We provide for the first time a published regression equation for calculation based on BSA of the expected size of the ascending aorta in children, which allows calculation of z scores.

Their data is based on a sample of 88 normal patients- the sample size was chosen to match their group of patients with bicuspid aortic valve. Technically speaking, this sample size is too small to be used to construct reference values. The demographic data describing the reference population is not provided.

The manner of z-score prediction was modeled after Daubeney et al., for "consistency with the prediction equations... used for other structures in our echocardiographic laboratory". Personally, I think that the "transform both sides" technique (regressing the log of both the BSA and the AAO measurements) is perfectly reasonable for modeling this relationship. However, I continue to have misgivings about the patent substitution of the regression root mean square error for the sample standard deviation- particularly for the purpose of calculating a z-score.

In the absence of any other AAO z-score equations, I used the following two manners to cross-check the Halifax data:

  1. The "internally standardized" approach of Sheil et al., using the observed consistent ratio between the size of the AAO and the aortic annulus: 1.16. I used the Boston aortic valve z-score data in combination with their ratiometric approach- I call these the Derived AAO values.
  2. Data from UCLA was used to generate z-scores for an exploration of dilated aortic root in children with bicuspid aortic valves. Their published data provide us with a formula for predicting a height-based mean value for the AAO.
BSA:
 
 
MethodAOV MeanAAO MeanRangeAAO/AOV
Halifax :
Derived :
UCLA: 
  

Dilatation of the ascending aorta in paediatric patients with bicuspid aortic valve: frequency, rate of progression and risk factors.
Warren AE, Boyd ML, O'Connell C, Dodds L. Heart. 2006 Oct;92(10):1496-500. Epub 2006Mar 17.
Echocardiographic assessment of aortic root dimensions in normal children based on measurement of a new ratio of aortic size independent of growth.
Sheil ML, Jenkins O, Sholler GF. Am J Cardiol. 1995 Apr 1;75(10):711-5.
Validation and re-evaluation of a discriminant model predicting anatomic suitability for biventricular repair in neonates with aortic stenosis.
Colan SD, McElhinney DB, Crawford EC, Keane JF, Lock JE. J Am Coll Cardiol. 2006 May2;47(9):1858-65. Epub 2006 Apr 17.
Frequency of aortic root dilation in children with a bicuspid aortic valve.
Gurvitz M, Chang RK, Drant S, Allada V. Am J Cardiol. 2004 Nov15;94(10):1337-40.
Two-dimensional echocardiographic aortic root dimensions in normal children and adults.
Roman MJ, Devereux RB, Kramer-Fox R, O'Loughlin J. Am J Cardiol. 1989 Sep1;64(8):507-12.
Interpretation of echocardiographic measurements: a call for standardization.
Vasan RS, Levy D, Larson MG, Benjamin EJ. Am Heart J. 2000 Mar;139(3):412-22.
Relationship of the dimension of cardiac structures to body size: an echocardiographic study in normal infants and children.
Daubeney PE, Blackstone EH, Weintraub RG, Slavik Z, Scanlon J, Webber SA. CardiolYoung. 1999 Jul;9(4):402-10.

Friday, November 21, 2008

Smackdown Revisited

After tackling the z-score:percentile issue, I thought it might be interesting to graph how different z-score equations look in this light. Here is what I derived as the cumulative density function for the aortic valve z-score (1.0 m2; male) using data published from Boston, Wessex, Cincinnati, and Detroit:

aortic_valve_cdf

I think that because I have explained z-scores to our students and fellows so many times, and made use of my own roughly drawn bell-shaped curve, this next depiction of the probability density function highlights the differences most strikingly for me:

ava_percentiles

The mean (50th percentile) of the Wessex data is clearly and importantly different than the others... and only the Cincinnati data demonstrates an appreciable degree of skewness, with a long right tail. Of course, none of the investigators mention how they tested for skewness (mean/median/mode?).

(This post is an elaboration of an earlier comparison of different published z-score equations that graphically depicted the predicted mean values of the aortic valve annulus.)


Validation and re-evaluation of a discriminant model predicting anatomic suitability for biventricular repair in neonates with aortic stenosis.
Colan SD, McElhinney DB, Crawford EC, Keane JF, Lock JE.
J Am Coll Cardiol. 2006 May 2;47(9):1858-65. Epub 2006 Apr 17.
Relationship of the dimension of cardiac structures to body size: an echocardiographic study in normal infants and children.
Daubeney PE, Blackstone EH, Weintraub RG, Slavik Z, Scanlon J, Webber SA.
Cardiol Young. 1999 Jul;9(4):402-10.
Two-dimensional echocardiographic valve measurements in healthy children: gender-specific differences.
Zilberman MV, Khoury PR, Kimball RT.
Pediatr Cardiol. 2005 Jul-Aug;26(4):356-60. Erratum in: Pediatr Cardiol. 2008 Mar;29(2):475.
Regression equations for calculation of z scores of cardiac structures in a large cohort of healthy infants, children, and adolescents: an echocardiographic study.
Pettersen MD, Du W, Skeens ME, Humes RA.
J Am Soc Echocardiogr. 2008 Aug;21(8):922-34. Epub 2008 Apr 11.

Saturday, November 1, 2008

Echo Z-Scores and Percentiles

I recently revisited the idea of calculating percentiles in addition to z-scores for the pediatric echo z-score calculators.

The cumulative percent is shown along with the z-score in the following image:


Since the relationship between z-score and percentile is constant, it seemed to me of no great benefit to add the percentile information. However, I now feel that percentiles convey information that some find more meaningful. For instance, the commonly accepted limits of normal for z-scores is -2 to +2 (the middle 95% of values). This range corresponds to percentiles of 2.3 and 97.7. But maybe a more realistic range of normal is

  • 5th - 95th percentiles: z-scores of ± 1.65
  • 10th - 90th percentiles: z-scores of ± 1.3

Using percentiles might encourage us to draw a more conservative boundary for the range of normal, which, in my opinion, will help us interpret otherwise "borderline" z-scores. Accepting the normal range of ±2, a z-score of -2.3 doesn't seem that far off. However, -2.3 is the 1st percentile- clearly nowhere near "normal".


Initially, I had thought that maybe I'd find a z-score/percentile table,  and simply incorporate a lookup routine, percentilesTable

but I like the idea of calculating the percentile better. However, the calculation (or rather, estimation) is hardly straightforward.

After some searching and trial and error, I finally found something that I could adapt. I admit I don't really understand how the polynomial approximation works, but hey, it does work, and it's in the public domain.

The first z-score calculator to receive the percentiles "upgrade" is the Aortic Root Z-Score Calculator. I hope to add the functionality to the others as well, as time permits.

Wednesday, October 22, 2008

Designing a Pediatric Echo Database

Having trolled the literature in an effort to consume and digest what has already been published in the name of "Pediatric Echo Normal Values" and "Pediatric Echo Reference Values" I have come to the conclusion that what I really wanted was this: a common collection of normative data, from which we could all draw our own conclusions.

That doesn't exist.

Yet.

There now appears to be growing and international interest in the matter of a common source of reference data for pediatric echo. An editorial (ePub ahead of print) in the  European Journal of Echocardiography now is calling for:

immediate discussions of a universal standard...
a concerted and collaborative international approach...
a single study to allow z-score computation...
a robust set of normal values, derived from a large number of individuals...

I hope the European Society of Echo plans on discussing this similar matter with the American Society of Echo (or vice-versa) before things get too far along...

While it is looking like this project is in much more capable hands than my own (thankfully!), had I to do it myself it was going to be guided by one thing: data transparency.

Show me the data

After having read some of the literature, I would occasionally find myself wondering "What if they had used a different BSA equation?", or "what if they had used height instead?" or used a different regression model, etc. For myself, I would love to see some of the studies re-done, but just slightly different.

Of course, nobody is going to do that— re-calculate their regressions— just because I, or you, want to see it done with our own particular and fanciful bias. And that is the point of a full disclosure database: DIY if you don't like this flavor. And, increasingly, I think that people will want to do just that. As an example, there is a preponderance of evidence that BSA, height, and weight are all inadequate for the purpose of scaling:

The cardiovascular system has evolved for effective distribution of metabolic substrates to tissue with high metabolic potential (Circ. 2008)

Cardiovascular structures scale with cardiac output and lean body mass.

In a very practical sense, there is no way to measure lean body mass (LBM) in the echo lab so the need for a good surrogate remains. Foster et. al., have already hinted at the concept of re-combining height and weight to better estimate lean body mass:

The combination of height and weight may provide a better surrogate for lean body mass than height alone, which could result in a superior prediction... This approach differs from normalization for body surface area; although body surface area equations include both height and weight, the particular combination of height and weight is lost once the surface area calculation is done.

Without providing open access to collected variables, like height and weight, any future data collection/analysis risks becoming irrelevant as our understanding of scaling cardiovascular structures evolves.

Show me more data

One of the biggest problems (IMHO) with the current approach to reference values is related to the matter of prediction. Different authors have proposed various methods of trying to predict the mean value of a given structure for a given body size, and these authors have similarly varied approaches to predicting the standard deviations. Understanding the relationship of the structure to body size is profound- and obviously important- but it is a different matter to determine if your measurement is normal- or not. For the purposes of reference values, the precise relationship of cardiac structure to body size doesn't matter.

At its essence, a z-score has nothing to do with regression equations. Whenever we make an echocardiographic measurement, and consider its "normality" all we are really asking is "how does this measurement compare to the same measurement of normal subjects with similar size ?" That is, what is the mean and standard deviation of the same structure measured in a large group of similar-sized normal subjects?

The exact relationship and regression doesn't matter- as long as we have a collection of enough data on similar-sized subjects. What is required, though is... an awful lot of data, grouped in a meaningful way. The number of required subjects is daunting: grouped the way they did in their study (by height), an LV Mass reference database modeled after Foster et al., should probably have tens of thousands of subjects: 145 groups (47 to 191 cm, in 1 cm increments) x 100-200 subjects in each group (although, I would think the increment could safely be increased to 2 cm, thereby cutting the number of groups in half). This is why there is so much in the way of prediction: you need fewer patients. In spite of the huge numbers required, the study by Foster et al., is, or probably should be, the model for the future of echocardiographic reference values.

Even More Data

In the same way that our understanding of scaling of cardiovascular structures is evolving (height vs. BSA vs. LBM) , so too is our ability to measure these cardiovascular structures. Similar databases of reference values for the various Doppler modalities and 3D echo measures should be taken into consideration.

The architecture of this database could have long lasting effects. Designing a large database of common reference measurements for data transparency will allow us to continually make the most intelligent use of the tremendous effort required to collect this data.


Normalization of echocardiographically derived paediatric cardiac dimensions to body surface area: time for a standardized approach.
Kaski JP, Daubeney PE.
Eur J Echocardiogr. 2008 Sep 30. [Epub ahead of print]
Does size matter? Clinical applications of scaling cardiac size and function for body size.
Dewey FE, Rosenthal D, Murphy DJ Jr, Froelicher VF, Ashley EA.
Circulation. 2008 Apr 29;117(17):2279-87. Review.
A novel method of expressing left ventricular mass relative to body size in children.
Foster BJ, Mackie AS, Mitsnefes M, Ali H, Mamber S, Colan SD.
Circulation. 2008 May 27;117(21):2769-75. Epub 2008 May 19.
Interpretation of echocardiographic measurements: a call for standardization.
Vasan RS, Levy D, Larson MG, Benjamin EJ.
Am Heart J. 2000 Mar;139(3):412-22.

Friday, October 3, 2008

Aortic Stenosis: Discriminant Score

Based on work from Boston Children's Hospital, this calculator determines the aortic valve z-score and the discriminant score — for "predicting which neonates with AS are suitable for biventricular repair and which are better served by single ventricle management."

Discriminant Score Calculator

 
Results


Analysis:

"If EFE is omitted from the analysis (owing to high interobserver variability in grading), the most accurate model for predicting survival with a biventricular circulation is: 12.16 (BSA) + 0.59 (aortic valve annulus z-score) + 5.73 (LAR) - 7.02 with a discriminant cutoff of -0.46 accurately predicting 91% of survivors and 80% of events (87% overall)."

References:

Validation and Re-Evaluation of a Discriminant Model Predicting Anatomic Suitability for Biventricular Repair in Neonates With Aortic Stenosis
Steven D. Colan, MD*, Doff B. McElhinney, MD, Elizabeth C. Crawford, RDCS, John F. Keane, MD and James E. Lock, MD
J Am Coll Cardiol, 2006; 47:1858-1865, doi:10.1016/j.jacc.2006.02.020 (Published online 11 April 2006).


(Since I dropped this calculator from the ParameterZ.com remodel, I had to find a new home for it... here.)

Thursday, September 25, 2008

The future of Z

While I am not going to rush out to get the first web-enabled washing machine, I am keen on Google's vision of the future, and commonality of scientific data:

Scientific measurements and experimental results will be blogged and automatically entered into common data archives to facilitate the distribution, sharing and reproduction of experimental results.

I have not yet given up on the idea of the common database of reference values for pediatric echo...

I hope to have a working mock-up soon. On second thought, maybe I will wait a bit.

It seems that the "Pediatric Measurements Writing Group of the American Society of Echocardiography and Congenital Heart Disease Council" is indeed making headway. According to the council's Fall 2008 Newsletter:

The current plan is to have a first draft of the document available for review at the American Heart Association meeting in November.

Members of the writing group include SD Colan and T Geva from Boston Children's Hospital... So this should be the definitive "how-to" for pediatric echo z-scores.

Wednesday, July 23, 2008

Aortic Stenosis: Calculating Valve Area and Pressure Recovery

The January 2008 issue of JASE includes the article:

Routine Adjustment of Doppler Echocardiographically Derived Aortic Valve Area Using a Previously Derived Equation to Account for the Effect of Pressure Recovery (source)

Wherein the matter of cath vs. echo discrepancies in evaluating aortic stenosis is addressed. While this article focuses on the matter of the aortic valve area, prior work has directed attention to the differences in gradients:

Comparison of simultaneous invasive and noninvasive measurements of pressure gradients in congenital aortic valve stenosis (source)

Combining the concepts of the two articles, this calculator considers both pressure recovered valve area and gradient estimations, as given by the formulae in the aforementioned articles:

AVAPressRecov

PressRecovFormula

Aortic Stenosis Valve Area and Pressure Recovery Calculator


(I originally busted this out back in January; it has been updated to run as a JavaScript calculator so as to be compatible here in it's new home on Blogger)


update, Nov. 2014:

The calculator on this site is broken :-| .

So I moved it: www.parameterz.com/tools/aortic-valve-area-and-pressure-recovery.

Sunday, July 20, 2008

Aortic Valve Z-Score Smackdown

After overcoming my perplexity about the distribution of left atrial scores, I thought it might be interesting to look a little closer at how other normative data is predicted.

For the sake of simplicity and to illustrate the point, the estimation of BSA from height and weight has been omitted and the Cincinnati z-score calculation is limited to "boys".

Aortic Valve Z-Score Comparison

What's The Difference?

In part: Skewness.

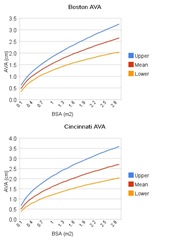
That is to say, the Cincinnati, Michigan, and Wessex data are all modeled as having positive skew, whereas the Boston data demonstrates a normal distribution about the mean:

BostonCinciAVA

Their difference is perhaps most apparent as an overlay (_B=Boston):

boston_&_cincinnati_overlay

Fortunately, most of the predictions perform well when evaluating for hypoplasia. The "big" question is how do you want to deal with dilation? Compared to the Boston predictions, the Cincinnati predictions will call an abnormal, dilated aortic valve "normal" (a false negative). Conversely, The Boston data will call an abnormal on what would otherwise be considered normal in Cincinnati (a false positive).

Which type of error are you willing- or unwilling- to make?

Saturday, July 19, 2008

LV Mass Z-Scores

"...these could easily be included in echocardiography software, which would allow automated generation of an LV mass-for-height z score and percentile for each child undergoing echocardiography."


A Novel Method of Expressing Left Ventricular Mass Relative to Body Size in Children [link]

Bethany J. Foster, MD, MSCE; Andrew S. Mackie, MD, SM; Mark Mitsnefes, MD; Huma Ali;
Silvia Mamber, MD; Steven D. Colan, MD

Circulation. 2008;117:2769-2775 Published online before print May 19, 2008


Apart from debunking the practice of simply indexing LV mass by dividing mass by height, the "novel method" is the LMS (lambda, mu, sigma) method of analysis. While I couldn't paint my way out of a Box-Cox transformation, I get the idea: the lambda (power transformation to deal with skew), mu (mean), and sigma (coefficient of variation) are determined for each of many groups, elegantly- and deliberately- addressing the matters of skewness and heteroscedasticity.


Lots to read up on with this technique:


  • The LMS method for constructing normalized growth standards [link]
  • Smoothing reference centile curves: the LMS method and penalized likelihood [link]
  • download LMS chart-making software from Tim Cole's website

The authors acknowledge that their data should not be taken to represent the definitive model of LV mass reference values, only that they are proposing the LMS technique as an alternate, superior, method.


Note: LV Mass was estimated from m-mode using the Devereux equation.


LV Mass Z-Score Calculator

Sunday, June 29, 2008

Echo Z-Score Suggested Reading

 wordle

Lots of people have asked me something like:

We are finding discrepancies in Z scores calculated by your method and the Z scores calculated by software provided by Boston...
WHY ?

I usually feel obligated to first set the record straight: these are not my z-score calculations. They are calculators based upon published literature, and I cite the source literature on the same page as the calculator... In some cases it is clear that this misconception is a language barrier issue, and I must apologize for that. English is the only language I know (well, apart from some Spanish, but most of that I can't repeat in polite company).

To really answer the question I have to admit: I don't really have all the words, or even some of the right words, and I am basically incapable of organizing them in a meaningful order.

Fortunately, the lucid discussion about reference values for pediatric echo, the matters of predicting echo normal values, and the general application of z-scores towards pediatric cardiology has already been done– and by people far brighter and more eloquent than me. I have read and (mostly) understand, and I therefore highly recommend, the following:

Why are your z-scores different? I don't know for sure, but I can take some guesses. Certainly, I recognize that there are differences.

The inevitable, and, possibly, better question is "Which one is most correct ?"

Friday, June 27, 2008

Universal Z-Score Calculations

According to the Spring issue of the ASE's Pediatric and Congenital Heart Disease Council News, interesting things are afoot:

The council has developed a Normative Database working group... to develop consensus methods for standardization of measures acquired during the pediatric echocardiogram with a long-term goal of creating a normative database of universally available standardized z-score calculations for the pediatric and young adult population.

I have toyed around a bit with making a few z-score calculators for pediatric echo universally available, and in the process one thing became clear: we are a long way from a consensus on z-scores. And, while enormously useful, the z-score calculators by themselves seem to only scratch the surface of what is now possible.

What is truly fascinating to me is the idea of a universal normative database. While I have yet to implement such a design through ParameterZ.com, what I have learned is: technology is not a barrier to creating an online pediatric echo reference values database.

What would be really cool is to marry the reference values with something that would...

... allow participants to create and generate web-based, secure echo reports that are standardized and complete.

(That is the ASE's promised echo toolbox reporting tool).


I have been contemplating the concept of web based pediatric echo z-scores and standardized echo reports for some time.

I have to say that I am excited and eager to see what more and greater minds come up with.

Wednesday, June 11, 2008

Fetal Ventricular Wall Dimensions

Reference values for fetal ventricular wall thickness are not easy to come by. This gadget is based on one of few available references.

Evaluation of Fetal Heart Dimensions from 12 Weeks to Term
Cora Firpo, MD, Julien I.E. Hoffman, MD, and Norman H. Silverman, MD
Am J Cardiol 2001 [link]

Measurements of the ventricular walls and septum were made from the "4-chamber" views, below the coapted AV valve leaflets, in diastole.

Monday, April 21, 2008

Children's Hospital of Michigan: Z-Scores of Cardiac Structures

This article is/will be absolutely huge for many pediatric echo labs:

J Am Soc Echocardiogr. 2008 Apr 10 [Epub ahead of print] (PubMed link)
Regression Equations for Calculation of Z Scores of Cardiac Structures in a Large Cohort of Healthy Infants, Children, and Adolescents: An Echocardiographic Study.
Pettersen MD, Du W, Skeens ME, Humes RA.

Carman and Ann Adams Department of Pediatrics, Wayne State University School of Medicine, Detroit, Michigan(M.D.P., W.D., R.A.H.).

Prediction equations (nonlinear regression analysis against BSA) are published for 21 M-mode and 2D echo measurements:

  1. RVDd
  2. IVSd
  3. IVSs
  4. LVPWd
  5. LVPWs
  6. LVIDd
  7. LVIDs
  8. Aortic valve annulus
  9. Sinuses of Valsalva
  10. Sinotubular junction
  11. Transverse aortic arch
  12. Aortic isthmus
  13. Distal aortic arch
  14. Aorta at diaphragm
  15. Pulmonary valve annulus
  16. Main pulmonary artery
  17. Right pulmonary artery
  18. Left pulmonary artery
  19. Mitral valve annulus
  20. Tricuspid valve annulus
  21. Left atrium

That pretty much covers everything from an echo measurement/congenital heart disease angle, so...
WOW.
Without a doubt, a tremendous bit of work on a large data set.

I find a few things about the article to be interesting:

  • This data looks to be to be a subset of a Detroit/D.C./Philips superset, presented in abstract form in 2004 (See JASE May 2004, Sable et. al.). Then, they presented data on over 6,000 patients... presented in this article, the authors claim to have analyzed a "large cohort"- which is undeniably true- but it is not as large as it might have been. There remains something proprietary about the superset. 
  • Some descriptions about the patient population are notable by their absence: the ranges of age and size, gender and race, and the manner in which the BSA was calculated. All seem to me to be typical required descriptions of the methodology, but are unreported in this presentation.
  • The choice of a polynomial/nonlinear regression model is unique, in light of recent work.

It is this last point—the choice of the regression model—that I find most interesting. Recent and prior work has demonstrated suitable models of cardiac growth using: an allometric equation (Neilan, Pradhan, and Weyman), the attractive principles of fluid dynamics and geometric similarity (Sluysmans & Colan), or even an old-school transform both sides (TBS) approach (Abbott & Gutgesell). None of these other models describe the "late deflection" in the relationship that this study's third order polynomial approach does. In my opinion, this may not ideally model the relationship of cardiac structures for larger patients. However, most of the work in pediatric cardiology deals with smaller patients, and the model's performance may be quite suitable for the majority of these patients.

Fascinations with the choice of model aside, this article represents the most comprehensive collection of z-score prediction equations for pediatric echocardiography to date. An online z-score calculator based on these equations can be found, of course, at

ParameterZ.com


It turns out that there is a considerable limitation of the application of this model to larger pediatric patients (like High School athletes). A large 15 year-old could be pushing 2.5 m2 and the model's predicted LVIDd for a patient of that size is an unreasonable 11-17 cm. I have therefore constrained the calculation to z-scores of subjects with BSA < 2.0m2

Friday, April 11, 2008

One Tail or Two? Z-Scores and The More Normal 95 Percent

The question is between two definitions of "95% of normal". On the one hand is the camp, like those describing the Strong Heart Study, that says:

Normal is a z-score of ± 2

Their 95% is the same 95% that is the confidence interval, i.e.: 95% of the population falls within 1.96 standard deviations of the mean- the middle 95%.

We normally round the 1.96 to 2... and that is one way to consider the normal population- the two-tailed approach.

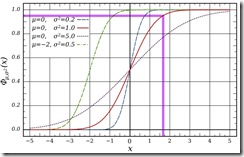
But what if you started at one end of the spectrum, and counted the population going towards the other side? This counts the cumulative distribution, graphically presented here:

95CDF

(the red curve is the normal distribution)

If you respect your normal population in this manner, as did the investigators of the Framingham Heart Study, you get:

95% of the population is accounted for by a
z-score of 1.645

That is to say, 95% of the population is below a z-score of approximately +1.7- the bottom 95%. That is the one-tailed approach. The difference between one-tailed and two-tailed definitions of normal looks like this:

one-sided

Interestingly, the Framingham study described five categories:

We classified values of each echocardiographic variable into the following five categories based on sex- and height-specific percentiles (indicating increasing deviation from the reference limits):

  • category 0 (reference limits), value <=95th percentile of the reference sample;
  • category 1, 95th percentile of reference sample<value<=95th percentile of broad sample;
  • category 2, 95th percentile of broad sample<value<=98th percentile of broad sample;
  • category 3, 98th percentile of broad sample<value<=99th percentile of broad sample; and
  • category 4, value >99th percentile of broad sample.

Their categorization contains one category more than the usual normal-mild-moderate-severe break down... I think I will call z-scores of 1.7 - 2 "borderline".


All of this depends upon the values having a normal distribution. If the values are not normally distributed, everything goes out the window. This makes me slightly uncomfortable with z-scores and reference values that describe only the "transformed values" as having such a distribution- but maybe that's just me.

What about you?
What considerations do you make about your normal population?

Wednesday, April 9, 2008

Z-Scores and Standardized Reporting of Abnormal Echo Measurements

In what appears to be some small bit of determinism of my own, I have arrived at this point in the implementation of a data-driven, standardized echo report:

Can we use z-scores to determine the severity of abnormal findings?

Certainly, we are already doing this- with widely varying effect:

And, from my recent ad hoc survey:

To me, it seems as though there continues to be no consensus- no standardization- in spite of our obvious need.

A scientifically rigorous approach to the categorization of abnormal findings, that takes into consideration the spectrum of disease, is proposed by Vasan et al.:

We classified values of each echocardiographic variable into the following five categories based on sex- and height-specific percentiles (indicating increasing deviation from the reference limits):

  • category 0 (reference limits), value <=95th percentile of the reference sample;
  • category 1, 95th percentile of reference sample<value<=95th percentile of broad sample;
  • category 2, 95th percentile of broad sample<value<=98th percentile of broad sample;
  • category 3, 98th percentile of broad sample<value<=99th percentile of broad sample; and
  • category 4, value >99th percentile of broad sample.

What we don't yet have in pediatric echo is the benefit of their "broad sample"- the larger population that includes individuals with disease and echocardiographic abnormalities. All we have to go by are the normal patients used to construct the z-scores... and so we have to make educated guesses at what this "other" population might look like.
Here's my (somewhat) educated (and exaggerated, for effect) guess:

distrubution overlay

(typical "normal" sample in blue, speculated "broad" sample in purple)

In the absence of precise (or, for that matter, any) knowledge of the "broad sample", an approach we can still use is advocated by the authors of the Strong Heart Study:

... by the simple procedure, which we have used previously, of considering values

  • 2 to 3 standard deviations from the normal mean as mildly abnormal,
  • 3 to 4 standard deviations as moderately abnormal, and
  • >4 standard deviations as severely abnormal.

As a simple and purely anecdotal test, let's see how two different hypothetical patients stand up to this classification- both chosen to be deliberately on the severe side of the spectrum:

  1. Infant with HLHS: BSA = 0.21; aortic root  = 0.2 cm
  2. Teenager with Marfan's: BSA = 2.0; aortic root = 5 cm

The aortic root z-scores are:

  1. -5.9
  2. +6.3

Both are appropriately classified by this scheme and easily meet criteria as severe.

Works for me, so far.

This appears to work for the ASE, as well. This same scheme was adopted by the ASE in their most recent Recommendations for Chamber Quantification.

Short of requiring subjective gradation of every measurement, and in the absence of anything better, this is what will probably be adopted in an effort to  avoid reporting errors within our echo reports. Some fine-tuning may be required to address any possible differences between the severity of hypoplasia vs. dilatation, and I would also not be surprised to discover some minor differences in how individual cardiac structures tolerate variations from the mean.

So, back to the question: Can we use z-scores to determine the severity of abnormal findings?

I think so.
What do you think? Is there a better way?

references and related links

Thursday, April 3, 2008

Echo Z-Score Cutoff Values Survey

So, you have your Z-Score. Now what?

Certainly, you can use it to dichotomize your findings into normal or abnormal. Possibly, you might use the z-score to further stratify your abnormal findings into mild, moderate, or severe (dilatation or hypoplasia)- which leads me to a couple of central questions, which may challenge some accepted practices:

  • what z-scores do you consider normal?
  • what z-scores do you consider as the thresholds for varying grades of abnormal?

Help shape the future of the data-driven echo report:

Take the survey

View the results

Sunday, March 2, 2008

Cardiac Cath Diagrams: Not Just For Cath Anymore

My physiology professor called them "cartoons".cath diagram

One of our docs here called them "valentines".


However you refer to them, the diagrams that comprise Congenital Heart Disease, A Diagrammatic Atlas are, without a doubt, indispensable for students and practitioners of pediatric echocardiography. Sadly, according to most online retailers, this atlas is no longer published. If you can find a copy anywhere- grab it and don't let go.

Fortunately for those without a hardcopy, many of the diagrams have been published on the web, with permission from the editors, at the Nevil Thomas Adult Congenital Heart Library. The website is a terrific collection of information, not the least of which is their collection of "CHD Heart Pictures".

Why every abnormal echocardiogram report doesn't include a diagram like those from the atlas is beyond me.

By the way, check out paint.net for a rockin', free image editor.

Sunday, February 17, 2008

Pediatric M-Mode Z-Scores

(Note: the calculator is now HERE )

I finished off what I thought were the more useful z-score calculations based on data from the article "Normal values of M mode echocardiographic measurements of more than 2000 healthy infants and children in central Europe" (link). Included in this calculator are z-scores and normal ranges for:

  • right ventricle (RVDD)
  • ventricular septum (IVS)
  • left ventricle end diastolic dimension (LVEDD)
  • left ventricle end systolic dimension (LVESD)
  • posterior wall (LVPW)
  • left atrial diameter (LAD)

I excluded calculations of the RV free wall, wall thickness in systole, and the arterial diameters- in part because I am not routinely reporting these measurements, but also because I question the application (PA diameter by m-mode??). Also, I hesitate to include the calculation of the left atrial z-score because reporting left atrial volumes is so much more descriptive, but alas I am not prepared to calculate LA volume z-scores for pediatrics...

I tried to use the published regression equations, both for the sake of simplifying the calculation and for the "continuously variable" effect, but ultimately abandoned this approach for several reasons:

  • The regression often did not yield the same result as the tabular data. For instance, using the formula for LVEDD for a child with a BSA of 0.5 m2 predicts a diameter of 28.19 mm; using the published table, the value is shown as 29.0 mm. The IVS predicted by the equation for patients with BSA's of 0.25 m2 and 2.0 m2  is 3.48 mm and 7.5 mm respectively; the same data from the tables is 3.8 mm and 9.3 mm.
  • I had to build a "lookup" routine for the standard deviations. As the authors did not publish prediction equations for the standard deviations, the values had to be hashed from a table anyhow. Adding another lookup table for the mean values was not much more work.
  • Infants were grouped by weight rather than BSA. Because, according to the authors "body surface area changes only minimally." The authors do not explore this topic any further though it begs the question of how the correlations were affected, i.e., what was the correlation coefficient when the infant's BSA was included in the analysis, and how much was it improved by removing them from the analysis? In part, the decision to break the infants out of the BSA relationship probably stems from a lack of understanding of the underlying relationship, as was recently and elegantly described by Sluysmans and Colan. Anyhow, because they grouped infants in this manner, z-scores could not be calculated using their prediction equations unless I mixed and matched the techniques (predict the mean using the BSA-based equation, and use tables to lookup the weight-based standard deviations).

In summation, this calculator simply addresses the published tables and performs lookup routines for the mean and standard deviation based on the appropriate index: weight for infants 2-4kg, BSA for subjects with BSA >0.25.


Update 6/2008: I re-worked the calculator to be quicker and prettier...

M-Mode Z-Score Calculator