The question is between two definitions of "95% of normal". On the one hand is the camp, like those describing the Strong Heart Study, that says:
Normal is a z-score of ± 2
Their 95% is the same 95% that is the confidence interval, i.e.: 95% of the population falls within 1.96 standard deviations of the mean- the middle 95%.
We normally round the 1.96 to 2... and that is one way to consider the normal population- the two-tailed approach.
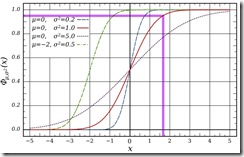
But what if you started at one end of the spectrum, and counted the population going towards the other side? This counts the cumulative distribution, graphically presented here:
(the red curve is the normal distribution)
If you respect your normal population in this manner, as did the investigators of the Framingham Heart Study, you get:
95% of the population is accounted for by a
z-score of 1.645
That is to say, 95% of the population is below a z-score of approximately +1.7- the bottom 95%. That is the one-tailed approach. The difference between one-tailed and two-tailed definitions of normal looks like this:
Interestingly, the Framingham study described five categories:
We classified values of each echocardiographic variable into the following five categories based on sex- and height-specific percentiles (indicating increasing deviation from the reference limits):
- category 0 (reference limits), value <=95th percentile of the reference sample;
- category 1, 95th percentile of reference sample<value<=95th percentile of broad sample;
- category 2, 95th percentile of broad sample<value<=98th percentile of broad sample;
- category 3, 98th percentile of broad sample<value<=99th percentile of broad sample; and
- category 4, value >99th percentile of broad sample.
Their categorization contains one category more than the usual normal-mild-moderate-severe break down... I think I will call z-scores of 1.7 - 2 "borderline".
All of this depends upon the values having a normal distribution. If the values are not normally distributed, everything goes out the window. This makes me slightly uncomfortable with z-scores and reference values that describe only the "transformed values" as having such a distribution- but maybe that's just me.
What about you?
What considerations do you make about your normal population?


