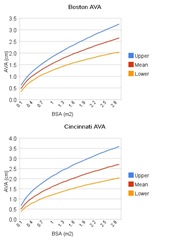
After overcoming my perplexity about the distribution of left atrial scores, I thought it might be interesting to look a little closer at how other normative data is predicted.
For the sake of simplicity and to illustrate the point, the estimation of BSA from height and weight has been omitted and the Cincinnati z-score calculation is limited to "boys".
Aortic Valve Z-Score Comparison
What's The Difference?
In part: Skewness.
That is to say, the Cincinnati, Michigan, and Wessex data are all modeled as having positive skew, whereas the Boston data demonstrates a normal distribution about the mean:
Their difference is perhaps most apparent as an overlay (_B=Boston):
Fortunately, most of the predictions perform well when evaluating for hypoplasia. The "big" question is how do you want to deal with dilation? Compared to the Boston predictions, the Cincinnati predictions will call an abnormal, dilated aortic valve "normal" (a false negative). Conversely, The Boston data will call an abnormal on what would otherwise be considered normal in Cincinnati (a false positive).
Which type of error are you willing- or unwilling- to make?


