Wednesday, July 23, 2008

Aortic Stenosis: Calculating Valve Area and Pressure Recovery

The January 2008 issue of JASE includes the article:

Routine Adjustment of Doppler Echocardiographically Derived Aortic Valve Area Using a Previously Derived Equation to Account for the Effect of Pressure Recovery (source)

Wherein the matter of cath vs. echo discrepancies in evaluating aortic stenosis is addressed. While this article focuses on the matter of the aortic valve area, prior work has directed attention to the differences in gradients:

Comparison of simultaneous invasive and noninvasive measurements of pressure gradients in congenital aortic valve stenosis (source)

Combining the concepts of the two articles, this calculator considers both pressure recovered valve area and gradient estimations, as given by the formulae in the aforementioned articles:

AVAPressRecov

PressRecovFormula

Aortic Stenosis Valve Area and Pressure Recovery Calculator


(I originally busted this out back in January; it has been updated to run as a JavaScript calculator so as to be compatible here in it's new home on Blogger)


update, Nov. 2014:

The calculator on this site is broken :-| .

So I moved it: www.parameterz.com/tools/aortic-valve-area-and-pressure-recovery.

Sunday, July 20, 2008

Aortic Valve Z-Score Smackdown

After overcoming my perplexity about the distribution of left atrial scores, I thought it might be interesting to look a little closer at how other normative data is predicted.

For the sake of simplicity and to illustrate the point, the estimation of BSA from height and weight has been omitted and the Cincinnati z-score calculation is limited to "boys".

Aortic Valve Z-Score Comparison

What's The Difference?

In part: Skewness.

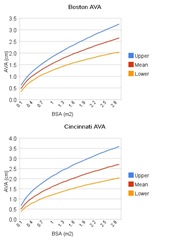
That is to say, the Cincinnati, Michigan, and Wessex data are all modeled as having positive skew, whereas the Boston data demonstrates a normal distribution about the mean:

BostonCinciAVA

Their difference is perhaps most apparent as an overlay (_B=Boston):

boston_&_cincinnati_overlay

Fortunately, most of the predictions perform well when evaluating for hypoplasia. The "big" question is how do you want to deal with dilation? Compared to the Boston predictions, the Cincinnati predictions will call an abnormal, dilated aortic valve "normal" (a false negative). Conversely, The Boston data will call an abnormal on what would otherwise be considered normal in Cincinnati (a false positive).

Which type of error are you willing- or unwilling- to make?

Saturday, July 19, 2008

LV Mass Z-Scores

"...these could easily be included in echocardiography software, which would allow automated generation of an LV mass-for-height z score and percentile for each child undergoing echocardiography."


A Novel Method of Expressing Left Ventricular Mass Relative to Body Size in Children [link]

Bethany J. Foster, MD, MSCE; Andrew S. Mackie, MD, SM; Mark Mitsnefes, MD; Huma Ali;
Silvia Mamber, MD; Steven D. Colan, MD

Circulation. 2008;117:2769-2775 Published online before print May 19, 2008


Apart from debunking the practice of simply indexing LV mass by dividing mass by height, the "novel method" is the LMS (lambda, mu, sigma) method of analysis. While I couldn't paint my way out of a Box-Cox transformation, I get the idea: the lambda (power transformation to deal with skew), mu (mean), and sigma (coefficient of variation) are determined for each of many groups, elegantly- and deliberately- addressing the matters of skewness and heteroscedasticity.


Lots to read up on with this technique:


  • The LMS method for constructing normalized growth standards [link]
  • Smoothing reference centile curves: the LMS method and penalized likelihood [link]
  • download LMS chart-making software from Tim Cole's website

The authors acknowledge that their data should not be taken to represent the definitive model of LV mass reference values, only that they are proposing the LMS technique as an alternate, superior, method.


Note: LV Mass was estimated from m-mode using the Devereux equation.


LV Mass Z-Score Calculator