Monday, April 21, 2008

Children's Hospital of Michigan: Z-Scores of Cardiac Structures

This article is/will be absolutely huge for many pediatric echo labs:

J Am Soc Echocardiogr. 2008 Apr 10 [Epub ahead of print] (PubMed link)
Regression Equations for Calculation of Z Scores of Cardiac Structures in a Large Cohort of Healthy Infants, Children, and Adolescents: An Echocardiographic Study.
Pettersen MD, Du W, Skeens ME, Humes RA.

Carman and Ann Adams Department of Pediatrics, Wayne State University School of Medicine, Detroit, Michigan(M.D.P., W.D., R.A.H.).

Prediction equations (nonlinear regression analysis against BSA) are published for 21 M-mode and 2D echo measurements:

  1. RVDd
  2. IVSd
  3. IVSs
  4. LVPWd
  5. LVPWs
  6. LVIDd
  7. LVIDs
  8. Aortic valve annulus
  9. Sinuses of Valsalva
  10. Sinotubular junction
  11. Transverse aortic arch
  12. Aortic isthmus
  13. Distal aortic arch
  14. Aorta at diaphragm
  15. Pulmonary valve annulus
  16. Main pulmonary artery
  17. Right pulmonary artery
  18. Left pulmonary artery
  19. Mitral valve annulus
  20. Tricuspid valve annulus
  21. Left atrium

That pretty much covers everything from an echo measurement/congenital heart disease angle, so...
WOW.
Without a doubt, a tremendous bit of work on a large data set.

I find a few things about the article to be interesting:

  • This data looks to be to be a subset of a Detroit/D.C./Philips superset, presented in abstract form in 2004 (See JASE May 2004, Sable et. al.). Then, they presented data on over 6,000 patients... presented in this article, the authors claim to have analyzed a "large cohort"- which is undeniably true- but it is not as large as it might have been. There remains something proprietary about the superset. 
  • Some descriptions about the patient population are notable by their absence: the ranges of age and size, gender and race, and the manner in which the BSA was calculated. All seem to me to be typical required descriptions of the methodology, but are unreported in this presentation.
  • The choice of a polynomial/nonlinear regression model is unique, in light of recent work.

It is this last point—the choice of the regression model—that I find most interesting. Recent and prior work has demonstrated suitable models of cardiac growth using: an allometric equation (Neilan, Pradhan, and Weyman), the attractive principles of fluid dynamics and geometric similarity (Sluysmans & Colan), or even an old-school transform both sides (TBS) approach (Abbott & Gutgesell). None of these other models describe the "late deflection" in the relationship that this study's third order polynomial approach does. In my opinion, this may not ideally model the relationship of cardiac structures for larger patients. However, most of the work in pediatric cardiology deals with smaller patients, and the model's performance may be quite suitable for the majority of these patients.

Fascinations with the choice of model aside, this article represents the most comprehensive collection of z-score prediction equations for pediatric echocardiography to date. An online z-score calculator based on these equations can be found, of course, at

ParameterZ.com


It turns out that there is a considerable limitation of the application of this model to larger pediatric patients (like High School athletes). A large 15 year-old could be pushing 2.5 m2 and the model's predicted LVIDd for a patient of that size is an unreasonable 11-17 cm. I have therefore constrained the calculation to z-scores of subjects with BSA < 2.0m2
Friday, April 11, 2008

One Tail or Two? Z-Scores and The More Normal 95 Percent

The question is between two definitions of "95% of normal". On the one hand is the camp, like those describing the Strong Heart Study, that says:

Normal is a z-score of ± 2

Their 95% is the same 95% that is the confidence interval, i.e.: 95% of the population falls within 1.96 standard deviations of the mean- the middle 95%.

We normally round the 1.96 to 2... and that is one way to consider the normal population- the two-tailed approach.

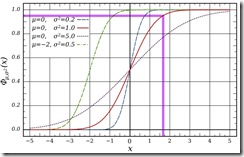
But what if you started at one end of the spectrum, and counted the population going towards the other side? This counts the cumulative distribution, graphically presented here:

95CDF

(the red curve is the normal distribution)

If you respect your normal population in this manner, as did the investigators of the Framingham Heart Study, you get:

95% of the population is accounted for by a
z-score of 1.645

That is to say, 95% of the population is below a z-score of approximately +1.7- the bottom 95%. That is the one-tailed approach. The difference between one-tailed and two-tailed definitions of normal looks like this:

one-sided

Interestingly, the Framingham study described five categories:

We classified values of each echocardiographic variable into the following five categories based on sex- and height-specific percentiles (indicating increasing deviation from the reference limits):

  • category 0 (reference limits), value <=95th percentile of the reference sample;
  • category 1, 95th percentile of reference sample<value<=95th percentile of broad sample;
  • category 2, 95th percentile of broad sample<value<=98th percentile of broad sample;
  • category 3, 98th percentile of broad sample<value<=99th percentile of broad sample; and
  • category 4, value >99th percentile of broad sample.

Their categorization contains one category more than the usual normal-mild-moderate-severe break down... I think I will call z-scores of 1.7 - 2 "borderline".


All of this depends upon the values having a normal distribution. If the values are not normally distributed, everything goes out the window. This makes me slightly uncomfortable with z-scores and reference values that describe only the "transformed values" as having such a distribution- but maybe that's just me.

What about you?
What considerations do you make about your normal population?

Wednesday, April 9, 2008

Z-Scores and Standardized Reporting of Abnormal Echo Measurements

In what appears to be some small bit of determinism of my own, I have arrived at this point in the implementation of a data-driven, standardized echo report:

Can we use z-scores to determine the severity of abnormal findings?

Certainly, we are already doing this- with widely varying effect:

And, from my recent ad hoc survey:

To me, it seems as though there continues to be no consensus- no standardization- in spite of our obvious need.

A scientifically rigorous approach to the categorization of abnormal findings, that takes into consideration the spectrum of disease, is proposed by Vasan et al.:

We classified values of each echocardiographic variable into the following five categories based on sex- and height-specific percentiles (indicating increasing deviation from the reference limits):

  • category 0 (reference limits), value <=95th percentile of the reference sample;
  • category 1, 95th percentile of reference sample<value<=95th percentile of broad sample;
  • category 2, 95th percentile of broad sample<value<=98th percentile of broad sample;
  • category 3, 98th percentile of broad sample<value<=99th percentile of broad sample; and
  • category 4, value >99th percentile of broad sample.

What we don't yet have in pediatric echo is the benefit of their "broad sample"- the larger population that includes individuals with disease and echocardiographic abnormalities. All we have to go by are the normal patients used to construct the z-scores... and so we have to make educated guesses at what this "other" population might look like.
Here's my (somewhat) educated (and exaggerated, for effect) guess:

distrubution overlay

(typical "normal" sample in blue, speculated "broad" sample in purple)

In the absence of precise (or, for that matter, any) knowledge of the "broad sample", an approach we can still use is advocated by the authors of the Strong Heart Study:

... by the simple procedure, which we have used previously, of considering values

  • 2 to 3 standard deviations from the normal mean as mildly abnormal,
  • 3 to 4 standard deviations as moderately abnormal, and
  • >4 standard deviations as severely abnormal.

As a simple and purely anecdotal test, let's see how two different hypothetical patients stand up to this classification- both chosen to be deliberately on the severe side of the spectrum:

  1. Infant with HLHS: BSA = 0.21; aortic root  = 0.2 cm
  2. Teenager with Marfan's: BSA = 2.0; aortic root = 5 cm

The aortic root z-scores are:

  1. -5.9
  2. +6.3

Both are appropriately classified by this scheme and easily meet criteria as severe.

Works for me, so far.

This appears to work for the ASE, as well. This same scheme was adopted by the ASE in their most recent Recommendations for Chamber Quantification.

Short of requiring subjective gradation of every measurement, and in the absence of anything better, this is what will probably be adopted in an effort to  avoid reporting errors within our echo reports. Some fine-tuning may be required to address any possible differences between the severity of hypoplasia vs. dilatation, and I would also not be surprised to discover some minor differences in how individual cardiac structures tolerate variations from the mean.

So, back to the question: Can we use z-scores to determine the severity of abnormal findings?

I think so.
What do you think? Is there a better way?

references and related links

Thursday, April 3, 2008

Echo Z-Score Cutoff Values Survey

So, you have your Z-Score. Now what?

Certainly, you can use it to dichotomize your findings into normal or abnormal. Possibly, you might use the z-score to further stratify your abnormal findings into mild, moderate, or severe (dilatation or hypoplasia)- which leads me to a couple of central questions, which may challenge some accepted practices:

  • what z-scores do you consider normal?
  • what z-scores do you consider as the thresholds for varying grades of abnormal?

Help shape the future of the data-driven echo report:

Take the survey

View the results