Showing posts with label skew. Show all posts

Wednesday, April 21, 2010

Kawasaki Disease Aneurysm Z-Scores: Another Smackdown

Boston Children’s versus Children’s National Medical Center for a “giant” knockout

When the Children’s National (CNMC) coronary artery z-score equations were published in 2008, I briefly compared them to the 2007 Boston data and noted their similarities. In my opinion, the manner in which the CNMC equations handle the “standard deviation” makes these incompatible with some newly proposed cutoffs. Let me explain.

Classifying Aneurysms

The current AHA criteria for classifying coronary artery aneurysms relies on a combination of z-scores and absolute diameters:

  • any segment with a z-score of > 2.5 = abnormal
  • <5 mm = small
  • 5 – 8 mm = large
  • ≥8 mm = giant

A recent article by Manlhoit et al. points out the folly of using absolute measurements in this instance. They then take the logical next step by introducing a classification system based on z-scores. Using their previously published data (from Boston, see above), the authors advocate the following coronary artery aneurysm z-score classification:

  • ≥2.5 – <5 = small
  • ≥5 – <10 = large
  • ≥10 =  giant

The clinical science behind establishing these cutoff points is presented in the article and is beyond the scope of what I am trying to do here. However, it is worth noting that (at least to me) the proposed system has a certain elegance and symmetry— it just seems reasonable.

Z-Score Equations

The Boston and CNMC equations each predict very similar values for the BSA adjusted mean diameter by using an allometric model. The two equations also yield similar results out to about z-scores of +2. But the similarities end where coronary artery abnormalities begin. Using the new criteria proposed for giant aneurysms ( z ≥10 ) and applying the CNMC equations, patients who previously had giant aneurysms ( ≥8 mm) now only have large aneurysms.
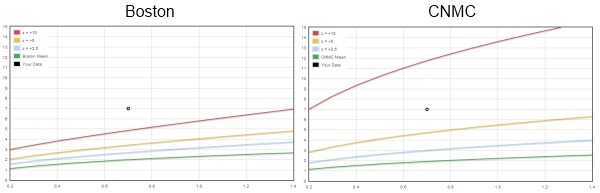
Boston vs. CNMC coronary artery z-score comparison

(See this page for the interactive comparison)

The big difference between the two z-score equations (z = [score – mean] / standard deviation ) is in how they deal with the standard deviation. The Boston equations use a separate regression (on BSA) to predict the SD, while the CNMC equations use the regression mean square error (MSE) statistic as a substitute for the SD.

Residuals

I have always been bothered by the patent substitution of the regression MSE (usually, the square root of the MSE i.e., the RMSE) for the population SD— particularly for the purpose of calculating z-scores. While the “transform both sides” strategy is perfectly legitimate for stabilizing the variance (and indeed, for discovering the allometric relationship!), if you play around with the regression residuals and then back-transform (i.e., exponentiate) your calculations — you have just modeled positive skew.

Detecting skew shouldn’t be all that hard to do. If the values are distributed normally, then it stands to reason that the residuals (observed - predicted) are also normally distributed. A simple plot of the residuals should show us what is going on. Here is the frequency vs. residuals plot from the recent fetal echo reference values of Lee et al.:

freq_v_resid-Lee 

(Similar residuals plots are provided by the crazy-cool online curve fitting at ZunZun.com.)

That’s not to say that skew doesn’t exist. Indeed, that is part of the point and elegance of the recently applied LMS method. It is imperative that we do something to examine the presence or absence of skew, and then describe how we intended to deal with it. Unfortunately, both of these investigations fail to mention this fundamental data characteristic in their respective manuscripts.

Bottom Line

Due to unexplored assumptions about the nature of the residuals/skew of the data, z-score cutoff values are not universal and are absolutely dependent upon their underlying reference z-score equations.

Sunday, January 3, 2010

New Fetal Echo Z-Score References

New fetal cardiac z-score equations from William Beaumont Hospital; new online calculator at OBSONO.org

Following up on their abstract from earlier this year, the group at William Beaumont Hospital in Royal Oak, Michigan produced what turns out to be the largest cross-sectional study of normative data for fetal cardiac measurements of all time:

Fetal echocardiography: z-score reference ranges for a large patient population.
Lee W, Riggs T, Amula V, Tsimis M, Cutler N, Bronsteen R, Comstock CH.
Ultrasound Obstet Gynecol. 2010 Jan;35(1):28-34.

Data from over 2700 normal pregnancies was used to construct z-score equations for the following fetal cardiac measures:

  • LV minor
  • RV minor
  • Aortic annulus
  • Pulmonary annulus
  • Cardiac circumference

By way of comparison, the previous work from Royal Brompton used data from 130 normal pregnancies; the more recent "unpublished" equations from Boston are based on observations made on 232 normal pregnancies. This new data eclipses both of these studies by at least an order of magnitude. For the purpose of generating normative data, "n" is everything, so statistically speaking, this study is HUGE.

The William Beaumont z-score equations deal with the prediction of the standard deviation in a manner similar to that used by the Boston folks, by a separate regression, thus deliberately accounting and controlling for the natural spread of data (heteroscedasticity). And, for what has to be one of the first, if not only, time- the authors also present a beautiful frequency vs. residuals plot and convincingly demonstrate that their data conforms to a normal distribution- a predicate for all z-score comparisons.

To better examine the differences and similarities of the various z-score equations I provide these tools, allowing for side-by-side comparison of the predicted z-scores, mean values, and normal ranges:

Fetal Aortic Valve Z-Score Comparison

smackdown-aov

Fetal LV Minor Z-Score Comparison

smackdown-lv

The authors also provide their own online fetal cardiac z-score calculator ( one-upping ParameterZ.com by generating pretty z-score plots ! ) at  www.obsono.org.


Speaking from the perspective of a pediatric cardiac sonographer, I have to recognize and thank the authors of this study for doing the work that we cannot do. Those of us in pediatric cardiology do not see a high volume of unselected, normal pregnancies and thus could never generate this kind of normative data.

Wednesday, November 11, 2009

Skew in Echocardiographic Reference Data

some offhand observations about the treatment of skewness in pediatric echo reference data.

Skewness:
1. asymmetry in a frequency distribution.
2. a measure of such asymmetry.

SkewedDistribution

Underlying the use of z-scores is an assumption about the symmetric nature of the distribution: the use of "Z" is because the normal distribution is also known as the "Z distribution". However, as noted elsewhere[1, 2], cardiac growth data are skewed to the right. Here are a few examples that I find remarkable.

Left Atrial Diameter

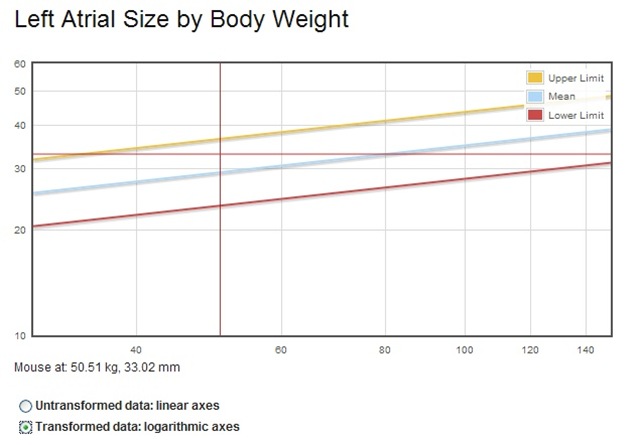
Neilan et al.[3] examined the nature of the relationship of body size to cardiac structures using the left atrial diameter as measured in over 15,000 normal patients. Their plot of LA diameter against body weight—and the underlying rightward skew—can be examined here: left atrial diameter vs. body weight. Although the chart is presented in the source article with logarithmic axes, "back transforming" the axes into natural units reveals the magnitude and direction of the skew.

left_atrial_diameter_vs_body_weight

Left Ventricular Mass

Using the LMS technique to deliberately account for skew (and non-constant variance), Foster et al.[4] provide the data used to construct the following curves: left ventricular mass vs. height (I used ±1.65 for the upper and lower bounds). Interestingly, while the LMS method handles the skew and variance in a discrete (although smoothed) fashion, applying a log transformation appears to control both phenomenon as well.

lv_mass_vs_height_plot

Fetal Data

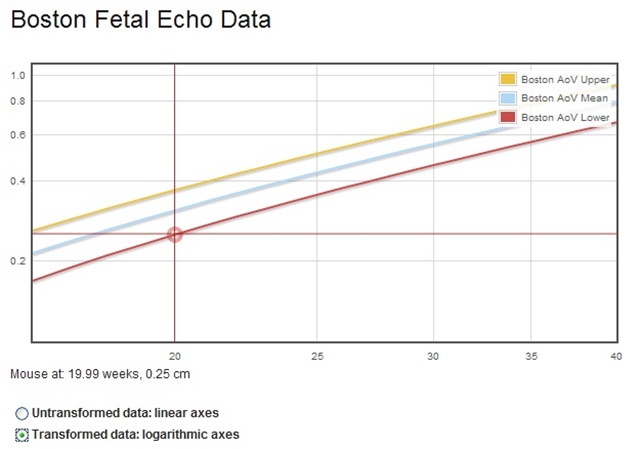
Comparing the recently published[5] fetal echo z-score data with the earlier reference[6] reveals one obvious difference: the Boston data is modeled as having a normal distribution, with no obvious skew. What, I wonder, happens if the underlying data really does have rightward skew, but is modeled as a normal distribution? Hmm...

fetal_skew


References

  1. Sluysmans T and Colan SD (2009). Structural Measurements and Adjustment for Growth. In Wyman Lai [et al.] (Eds.), Echocardiography in Pediatric and Congenital Heart Disease: From Fetus to Adult . Oxford: Wiley-Blackwell
  2. Abbott RD, Gutgesell HP. Effects of heteroscedasticity and skewness on prediction in regression: modeling growth of the human heart.
  3. Neilan TG, Pradhan AD, Weyman AE. Derivation of a size-independent variable for scaling of cardiac dimensions in a normal adult population.
  4. Foster BJ, Mackie AS, Mitsnefes M, Ali H, Mamber S, Colan SD. A novel method of expressing left ventricular mass relative to body size in children.
  5. McElhinney DB, Marshall AC, Wilkins-Haug LE, Brown DW, Benson CB, Silva V, Marx GR, Mizrahi-Arnaud A, Lock JE, Tworetzky W. Predictors of technical success and postnatal biventricular outcome after in utero aortic valvuloplasty for aortic stenosis with evolving hypoplastic left heart syndrome.
  6. Schneider C, McCrindle BW, Carvalho JS, Hornberger LK, McCarthy KP, Daubeney PE. Development of Z-scores for fetal cardiac dimensions from echocardiography.

Friday, November 21, 2008

Smackdown Revisited

After tackling the z-score:percentile issue, I thought it might be interesting to graph how different z-score equations look in this light. Here is what I derived as the cumulative density function for the aortic valve z-score (1.0 m2; male) using data published from Boston, Wessex, Cincinnati, and Detroit:

aortic_valve_cdf

I think that because I have explained z-scores to our students and fellows so many times, and made use of my own roughly drawn bell-shaped curve, this next depiction of the probability density function highlights the differences most strikingly for me:

ava_percentiles

The mean (50th percentile) of the Wessex data is clearly and importantly different than the others... and only the Cincinnati data demonstrates an appreciable degree of skewness, with a long right tail. Of course, none of the investigators mention how they tested for skewness (mean/median/mode?).

(This post is an elaboration of an earlier comparison of different published z-score equations that graphically depicted the predicted mean values of the aortic valve annulus.)


Validation and re-evaluation of a discriminant model predicting anatomic suitability for biventricular repair in neonates with aortic stenosis.
Colan SD, McElhinney DB, Crawford EC, Keane JF, Lock JE.
J Am Coll Cardiol. 2006 May 2;47(9):1858-65. Epub 2006 Apr 17.
Relationship of the dimension of cardiac structures to body size: an echocardiographic study in normal infants and children.
Daubeney PE, Blackstone EH, Weintraub RG, Slavik Z, Scanlon J, Webber SA.
Cardiol Young. 1999 Jul;9(4):402-10.
Two-dimensional echocardiographic valve measurements in healthy children: gender-specific differences.
Zilberman MV, Khoury PR, Kimball RT.
Pediatr Cardiol. 2005 Jul-Aug;26(4):356-60. Erratum in: Pediatr Cardiol. 2008 Mar;29(2):475.
Regression equations for calculation of z scores of cardiac structures in a large cohort of healthy infants, children, and adolescents: an echocardiographic study.
Pettersen MD, Du W, Skeens ME, Humes RA.
J Am Soc Echocardiogr. 2008 Aug;21(8):922-34. Epub 2008 Apr 11.

Sunday, July 20, 2008

Aortic Valve Z-Score Smackdown

After overcoming my perplexity about the distribution of left atrial scores, I thought it might be interesting to look a little closer at how other normative data is predicted.

For the sake of simplicity and to illustrate the point, the estimation of BSA from height and weight has been omitted and the Cincinnati z-score calculation is limited to "boys".

Aortic Valve Z-Score Comparison

What's The Difference?

In part: Skewness.

That is to say, the Cincinnati, Michigan, and Wessex data are all modeled as having positive skew, whereas the Boston data demonstrates a normal distribution about the mean:

BostonCinciAVA

Their difference is perhaps most apparent as an overlay (_B=Boston):

boston_&_cincinnati_overlay

Fortunately, most of the predictions perform well when evaluating for hypoplasia. The "big" question is how do you want to deal with dilation? Compared to the Boston predictions, the Cincinnati predictions will call an abnormal, dilated aortic valve "normal" (a false negative). Conversely, The Boston data will call an abnormal on what would otherwise be considered normal in Cincinnati (a false positive).

Which type of error are you willing- or unwilling- to make?