Showing posts with label MMode. Show all posts

Saturday, November 24, 2012

LVEDV Z-Scores

The second of two recent updates to app.parameterz.com is the addition of the left ventricular volume and dimension data supplied by this recent article:

Normalized end-systolic volume and pre-load reserve predict ventricular dysfunction following surgery for aortic regurgitation independent of body size.
Gentles TL, French JK, Zeng I, Milsom PF, Finucane AK, Wilson NJ.
JACC Cardiovasc Imaging. 2012 Jun;5(6):626-33.
(The equations are provided via an online supplement, supplied to me by the authors.)
Although the article describes equations for LV function and dimensions, I use only the dimensional z-scores. The form of these equations is that of an allometric relationship with BSA, with log-log transformation of both the measured value and the BSA.
The formula used for estimating BSA is not described within the article/supplement; I am awaiting a response from the authors on this. In the meantime, calculations are made using the Haycock formula.

LVEDD and LVESD

The allometric equations for the LVEDD and LVESD use exponents of around 0.4, which is slightly less than what would be expected by the theory of geometric similarity: 0.5. Numerous other authors have discovered linear relationships when correcting/adjusting linear dimensions (cm) to body surface area (m2). Additionally, the LVESD values seem a bit off when compared to other available sources:
image
(I have contacted the authors; awaiting their response)

LVEDV and LVESV

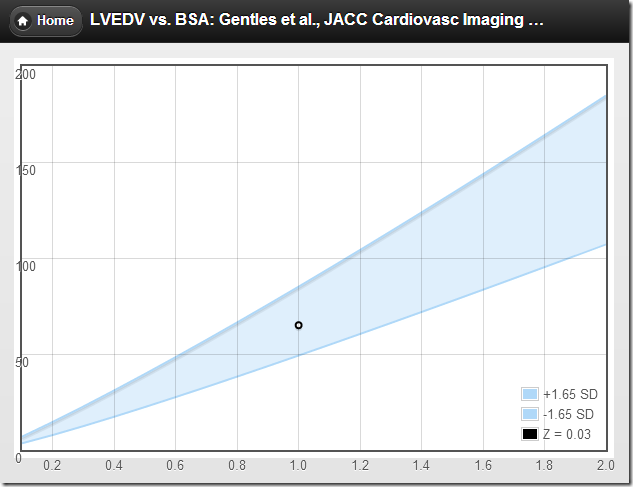
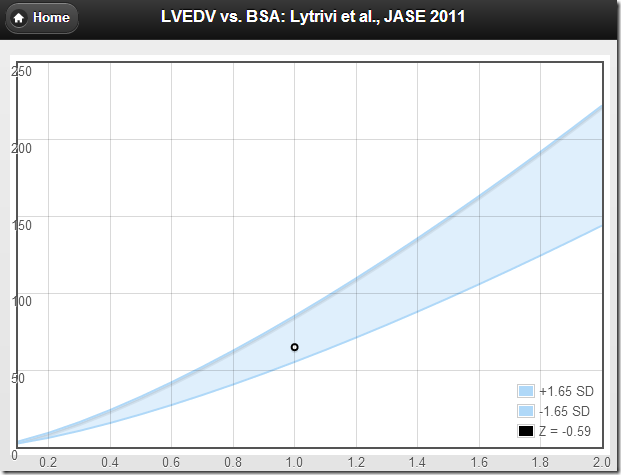
Data for the left ventricular volumes is also in the form of an allometric relationship with BSA, with an exponent of around 1.1. Again, this differs somewhat from what would be predicted by geometric similarity, and by other empirical evidence. The closer the exponent is to 1.0, the more the relationship is strictly linear with BSA, which is unexpected, particularly since the authors recognize this peril:
However, the relationship between body size and LV size is nonlinear
Yet, when you plot out the predicted values, it looks quite linear:
image
versus an allometric equation with an exponent of 1.38 (Lytrivi et al.):
image
Anyhow, given the paucity of ventricular volume z-score equations, these are now included among other pediatric echo z-score calculations at

app.parameterz.com


***update Dec 2012***
The author has advised me that there was an error with the online supplement.
"The intercept for ESD should be 2.56 NOT 3.56 as is on the web"
The app now uses the updated value.

Sunday, November 29, 2009

Pediatric RV Function (TAPSE) Z-Score Calculator

Z-Scores for RV systolic function.

Using data published in the June 2009 JASE, this calculator determines the age-adjusted Tricuspid Annular Plane Systolic Excursion (TAPSE) z-scores:

TAPSE

Notes:

For the purpose of calculating the z-score, I used the published mean and "-3SD" lower limit to calculate each SD ([mean – lower limit] / 3)- which is a little bit off-label. That is, the standard deviation by itself is not published— only the ±2 and ±3 ranges are published— and there is some variation in how those back-calculate to "1 SD". Even though the title of the article suggest using the data for calculating z-scores, it is not perfectly clear how we are supposed to do this.

For the purpose of drawing the plot, I used the published ±2 SD values (the 2.5 – 97.5 percentiles).

While the authors note the independent influence of BSA on TAPSE (they also provide a separate graph for BSA vs. TAPSE), it is not clear to me how we are supposed to apply this information. For each age group, a TAPSE/BSA index value is determined by dividing the mean TAPSE by the mean BSA for each age group. The indexed values are noted to decrease with increasing age/BSA. However, no range of normal indexed values is given. The manner in which BSA was estimated for the study is not presented. The BSA vs. TAPSE data used to construct their graph are not published.


References:

Right ventricular function in infants, children and adolescents: reference values of the tricuspid annular plane systolic excursion (TAPSE) in 640 healthy patients and calculation of z score values.
Koestenberger M, Ravekes W, Everett AD, Stueger HP, Heinzl B, Gamillscheg A, Cvirn G, Boysen A, Fandl A, Nagel B.
J Am Soc Echocardiogr. 2009 Jun;22(6):715-9. Epub 2009 May 7.

Sunday, August 2, 2009

Pediatric Echo Z-Score Calculator: Children's Mercy Hospital

Calculate z-scores and normal ranges for 80+ echocardiographic measures including m-mode, 2D, and Doppler; generate z-score graphs.

While browsing, I more-or-less stumbled upon a great website put together by the good folks at Children's Mercy Hospital (Kansas City, MO). The depth and breadth of measurements is astonishing, as is the number of observations from which the reference values are generated.

CMH generated z-score graph

I understand an article is forthcoming— destined to be the largest and most encompassing work to date on normative values for pediatric echocardiography.

CMH Pediatric Echo Z-Score Calculator

Also worth reading, their newsletter announcement: Creating New Growth Charts


Congratulations (and thanks!) to Dr. Drake and his staff for creating an incredible resource and service.

Thursday, June 4, 2009

LV Mass Reference Values: Smackdown

I am starting to think I should change the tagline for this blog to:
more questions than answers
I am in the midst of building another smackdown calculator:

LV Mass Smackdown

I hope that it use is self-explanatory and that it requires no introduction- because I am now out of time (heading out to the ASE meeting!).
This is still a 'work in progress' (I seem to have lots of these). Upon my return from the nation's capitol, I plan to add additional functionality:
  • tips on measurement technique
  • input validation
  • automatically detecting discrepancies between references
  • allowing users the opportunity to provide feedback in the cases where there are discrepancies
I think this is going to be very interesting ...

Sunday, February 17, 2008

Pediatric M-Mode Z-Scores

(Note: the calculator is now HERE )

I finished off what I thought were the more useful z-score calculations based on data from the article "Normal values of M mode echocardiographic measurements of more than 2000 healthy infants and children in central Europe" (link). Included in this calculator are z-scores and normal ranges for:

  • right ventricle (RVDD)
  • ventricular septum (IVS)
  • left ventricle end diastolic dimension (LVEDD)
  • left ventricle end systolic dimension (LVESD)
  • posterior wall (LVPW)
  • left atrial diameter (LAD)

I excluded calculations of the RV free wall, wall thickness in systole, and the arterial diameters- in part because I am not routinely reporting these measurements, but also because I question the application (PA diameter by m-mode??). Also, I hesitate to include the calculation of the left atrial z-score because reporting left atrial volumes is so much more descriptive, but alas I am not prepared to calculate LA volume z-scores for pediatrics...

I tried to use the published regression equations, both for the sake of simplifying the calculation and for the "continuously variable" effect, but ultimately abandoned this approach for several reasons:

  • The regression often did not yield the same result as the tabular data. For instance, using the formula for LVEDD for a child with a BSA of 0.5 m2 predicts a diameter of 28.19 mm; using the published table, the value is shown as 29.0 mm. The IVS predicted by the equation for patients with BSA's of 0.25 m2 and 2.0 m2  is 3.48 mm and 7.5 mm respectively; the same data from the tables is 3.8 mm and 9.3 mm.
  • I had to build a "lookup" routine for the standard deviations. As the authors did not publish prediction equations for the standard deviations, the values had to be hashed from a table anyhow. Adding another lookup table for the mean values was not much more work.
  • Infants were grouped by weight rather than BSA. Because, according to the authors "body surface area changes only minimally." The authors do not explore this topic any further though it begs the question of how the correlations were affected, i.e., what was the correlation coefficient when the infant's BSA was included in the analysis, and how much was it improved by removing them from the analysis? In part, the decision to break the infants out of the BSA relationship probably stems from a lack of understanding of the underlying relationship, as was recently and elegantly described by Sluysmans and Colan. Anyhow, because they grouped infants in this manner, z-scores could not be calculated using their prediction equations unless I mixed and matched the techniques (predict the mean using the BSA-based equation, and use tables to lookup the weight-based standard deviations).

In summation, this calculator simply addresses the published tables and performs lookup routines for the mean and standard deviation based on the appropriate index: weight for infants 2-4kg, BSA for subjects with BSA >0.25.


Update 6/2008: I re-worked the calculator to be quicker and prettier...

M-Mode Z-Score Calculator