Showing posts with label Coronary Arteries. Show all posts

Wednesday, January 12, 2011

Q and A with Frédéric and Nagib

The January issue of JASE holds this gem of a manuscript:


New equations and a critical appraisal of coronary artery Z scores in healthy children.
Dallaire F, Dahdah N.
J Am Soc Echocardiogr. 2011 Jan;24(1):60-74. Epub 2010 Nov 13.

The title couldn’t be any more fitting-- it is a must-read for anyone interested in the matter of z-scores for pediatric cardiology.

The authors have graciously agreed to allow me to post their answers to my “follow up  questions”:

Q: Thanks for introducing us to the Anderson-Darling normal distribution test. However, why not include a few frequency vs. residuals histograms for the cavemen in the audience like me? We like pictures...
A: We used such histograms in our analysis to “visually” assess normality. Our article was however long and we had to cut down some of the text and figures. Here’s the frequency distribution for left main coronary artery Z scores (final model with square root of body surface area) DallaireDistribution
Q: Are there other normality tests? Why the Anderson-Darling test?
A: The Anderson-Darling test tests whether a sample fit to a given distribution. When used to test for departure from normality, it is one of the most powerful. SAS also gives the results for the Kolmogorov-Smirnov and Cramer-von Mises tests, which are less sensitive.
Q: The power model described in the article has the form: y = a +b1x2+b2x Why isn't that a polynomial model (quadratic)? I was expecting a model of the form: y : x(see chart).
powers plot
Is this just a matter of semantics, or is the power model misnamed?
A: Yes, we should have named it a polynomial model.
Q: Judging by the spread/skew of the +/- 2SD curves on the “exponential model”, it looks like a log-normal curve... how did you treat the SD with this model?
A: In the exponential model, body surface area and coronary diameter were both log-transformed and then the model was fitted. The SD used was thus the one of a linear model on log-transformed values. Even with the logarithmic transformation, there was residual heteroscedasticity and a weighted least-square model was used. The weight in the model was the inverse of the linear regression of the residuals (on log-transformed values).
Q: Your “exponential model” empirically arrived at an exponent of 0.544-- similar to your theoretical “square root model”: y = a + b1x0.5. However, the Boston and Washington, D.C. models are similar and have exponents of something like 0.3xx. Is the difference between the exponents attributed to your larger sample size, or could there be something else going on here?
A: Hard to say. I would guess that aside from the greater sample size, it is likely the better representation of small children and infants that made the difference. If the theoretical model of optimal cardiovascular allometry proposed by Sluysmans and Colan in 2004 is true, it seems logical that a good representation of children from all ages helped to produce a “real-life” model close to the theoretical model proposed by Sluysmans and Colan.
Q: The final models described in the article are very similar in form to many of the z-score equations from Boston: 2 regression equations; one for the mean, one for the SD. However, the Boston equations predict the SD by a regression against BSA. Your SD equations are run against the square root of the BSA. How does one determine the best model for the variance?
A: The best model for variance should be determined in the same way the model for the mean is. That is, one should ensure that the residuals are free of a trend (no association should exist between the residual and the independent variable). In other words, there should not be an association between the residuals of the residuals and the dependent variable. This was verified for our data but was apparently not done in previous series, including Boston’s.
Q: I keep wondering: if we took a hundred patients with the same BSA, what is the mean/median/mode/min/max/distribution of those measurements? What does that curve look like? Had you considered using something like the “LMS” method to do a group-wise evaluation?
A: The use of a Z score assumes that the coronary diameters of x patients with a given BSA are normally distributed. In fact, our modelisation supposes that for any given value of BSA, there exists a number of subjects that are normally distributed around the mean (see our figure). If so, the median, mode and mean should be the same. The important thing is that in the absence of such a distribution, the Z score cannot be used to estimated percentiles, which is its principal (only?) value. In the lab, one wants to know if a coronary diameters exceeds the 95th or 98th percentile for a given BSA to be able to answer the question “is that coronary abnormal?”. Such percentiles can only be estimated if the data is normally distributed. Q8fig
Q: What do you think explains how the proximal RCA has a normal distribution in your analysis but the distal RCA does not?
A: The distal RCA has two particularities. 1) distal RCA is the most difficult to view and, therefore, to measure. We are confident all distal RCA measurements we use to compute our equations were properly imaged and measured (number of distal RCA samples are the lowest compared to the other segments in our report). The difficulty of obtaining good image might have played a part, but we do not think this is the main reason for the non normal distribution... 2) Essentially, the size of the distal RCA depends on whether or not the RCA is dominant or not (typically 2/3 vs 1/3 of normal humans). We think this is the most probable explanation for not perfectly symmetric variability among subjects. In brief, we believe that the dominance factor is the key answer. One way to verify this hypothesis is to take the adventure of measuring the distal circumflex (posterior rim) and compare with the distal RCA in a series of subjects...
Q: If you consider coronary arteries as a microcosm of the larger reference values issue in pediatric cardiology, what implications does your work have for the existing body of z-score equations?
A: Surprisingly, very little proper validation of reference values and normalisation has been done in paediatric echocardiography. We advocate for a close examination (and potentially a redo when appropriate) of nearly all equations so far available in the literature. Some of them are probably adequate, but in the absence of a good description of the final distribution, it is difficult to affirm with confidence.
Q: Do you have any advice for others, like the ASE, that are going forward with developing new models and z-score equations?
A: Simply fitting a modelled curve in the data is not enough. Since Z scores are dependent on the distribution of the data, one should absolutely test the Z score distribution obtained. One should also ensure that there is no residual trend and no residual heteroscedasticity. We believe that Z scores are a very useful tool for interpreting cardiac structure dimensions in paediatric settings. They must however be based on sound unbiased mathematical grounds.

Naturally, a z-score calculator has been posted up at ParameterZ.com:

http://parameterz.blogspot.com/2010/11/montreal-coronary-artery-z-scores.html

I also made this into it’s own project, making comparisons between the new data and previous coronary artery z-score equations:

http://code.google.com/p/parameterz-coronaries/

-- more on that later.

I thank and congratulate the authors for their outstanding manuscript, and for their patience and generosity by way of indulging me and my questions.

Wednesday, April 21, 2010

Kawasaki Disease Aneurysm Z-Scores: Another Smackdown

Boston Children’s versus Children’s National Medical Center for a “giant” knockout

When the Children’s National (CNMC) coronary artery z-score equations were published in 2008, I briefly compared them to the 2007 Boston data and noted their similarities. In my opinion, the manner in which the CNMC equations handle the “standard deviation” makes these incompatible with some newly proposed cutoffs. Let me explain.

Classifying Aneurysms

The current AHA criteria for classifying coronary artery aneurysms relies on a combination of z-scores and absolute diameters:

  • any segment with a z-score of > 2.5 = abnormal
  • <5 mm = small
  • 5 – 8 mm = large
  • ≥8 mm = giant

A recent article by Manlhoit et al. points out the folly of using absolute measurements in this instance. They then take the logical next step by introducing a classification system based on z-scores. Using their previously published data (from Boston, see above), the authors advocate the following coronary artery aneurysm z-score classification:

  • ≥2.5 – <5 = small
  • ≥5 – <10 = large
  • ≥10 =  giant

The clinical science behind establishing these cutoff points is presented in the article and is beyond the scope of what I am trying to do here. However, it is worth noting that (at least to me) the proposed system has a certain elegance and symmetry— it just seems reasonable.

Z-Score Equations

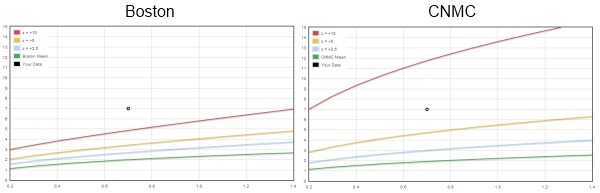
The Boston and CNMC equations each predict very similar values for the BSA adjusted mean diameter by using an allometric model. The two equations also yield similar results out to about z-scores of +2. But the similarities end where coronary artery abnormalities begin. Using the new criteria proposed for giant aneurysms ( z ≥10 ) and applying the CNMC equations, patients who previously had giant aneurysms ( ≥8 mm) now only have large aneurysms.

Boston vs. CNMC coronary artery z-score comparison

(See this page for the interactive comparison)

The big difference between the two z-score equations (z = [score – mean] / standard deviation ) is in how they deal with the standard deviation. The Boston equations use a separate regression (on BSA) to predict the SD, while the CNMC equations use the regression mean square error (MSE) statistic as a substitute for the SD.

Residuals

I have always been bothered by the patent substitution of the regression MSE (usually, the square root of the MSE i.e., the RMSE) for the population SD— particularly for the purpose of calculating z-scores. While the “transform both sides” strategy is perfectly legitimate for stabilizing the variance (and indeed, for discovering the allometric relationship!), if you play around with the regression residuals and then back-transform (i.e., exponentiate) your calculations — you have just modeled positive skew.

Detecting skew shouldn’t be all that hard to do. If the values are distributed normally, then it stands to reason that the residuals (observed - predicted) are also normally distributed. A simple plot of the residuals should show us what is going on. Here is the frequency vs. residuals plot from the recent fetal echo reference values of Lee et al.:

freq_v_resid-Lee 

(Similar residuals plots are provided by the crazy-cool online curve fitting at ZunZun.com.)

That’s not to say that skew doesn’t exist. Indeed, that is part of the point and elegance of the recently applied LMS method. It is imperative that we do something to examine the presence or absence of skew, and then describe how we intended to deal with it. Unfortunately, both of these investigations fail to mention this fundamental data characteristic in their respective manuscripts.

Bottom Line

Due to unexplored assumptions about the nature of the residuals/skew of the data, z-score cutoff values are not universal and are absolutely dependent upon their underlying reference z-score equations.

Sunday, March 22, 2009

Pediatric Echo Z-Score Graphs

I have been working on different visualizations of the data we see and use every day in the pediatric echo lab.

Consider the following hypothetical patient data:

  t0 t1 t2 t3
Height(cm): 55 58 65 75
Weight(kg): 3.5 3.9 4.5 7
LMCA (mm): 2.9 2.95 3.2 3.5

A simple graph of these individual measurements over time- particularly for pediatric patients- is potentially a bit misleading:

Coronary Artery Measurement Time Series Graph

While the graph clearly conveys the information that the coronary artery size changes over time, unless you also happen to know what the normal values are for each point in time, there is no way to know if the change in size is pathologic, or simply due to somatic growth.

This is the entire reason we use z-scores.

So, maybe more to the point- at least for the purpose of trending- would be to graph the z-scores over time:

Coronary Artery Z-Score Time Series Graph

(This simple LMCA graphing routine can be found here.)

However, neither graph is entirely satisfactory for me.
I want to see both the absolute values and their relationship to normal values… more like this:

LMCA ZScore Plot

Using the coronary artery z-score data published from Boston and the enormously cool JavaScript plotting library, flot,  I built a few more z-score graphing routines:

They're not perfect (I'd like the z-score to show as a 'tooltip' when hovering over individual data points, and the axes need labels...), but they are a lot more fun. If they seem useful, I may release more of them into the wild.

I'd love to know what anyone else thinks about graphing their pediatric echo data.


(special thanks to the authors of "Normal values for aortic diameters in children and adolescents – assessment in vivo by contrast-enhanced CMR-angiography" for the inspiration)

Tuesday, January 13, 2009

Line Fitting for Pediatric Cardiology (and everyone else)

Described as "one of the fundamental tasks of scientific inquiry", model selection could consume the better part of an afternoon and an important part of one's budgeted time with a statistician.

Enter ZunZun.com.

If you're looking for quality curve fitting and surface fitting, this is the site for you!

The power law applied by Sable et al. in their description of coronary artery reference values caught my attention. Particularly, the scaling exponents for the individual coronary arteries are all different, and not what I would have intuitively guessed them to be, based on the principle of geometric similarity. So, I wanted to test a theory: perhaps the coronary arteries scale well with something besides BSA.

Consider this small data set of 10 hypothetical patients:

Ht (cm) WT (kg) BSA (Haycock)
57 6.1 0.3187
61 7 0.3525
83 12.6 0.5464
98 14.2 0.6223
104 16.6 0.6930
120 20.5 0.8215
148 41 1.2961
172 88.6 2.0820
176 58 1.6729
178 65.5 1.7940

From this I predicted the diameter of the LAD and height-based LV mass for each hypothetical subject.
I then constructed a second table of super hypothetical data:

LV Mass (g) LAD (mm)
16.86 1.38
19.19 1.44
34.42 1.72
45.69 1.82
50.17 1.90
63.28 2.04
99.64 2.46
149.46 2.99
158.99 2.73
163.79 2.81

Then I did some line fitting:

hypothetical LAD vs. LVM

The model fitted is:

y = a * xb

The reported coefficients are:

a =  5.2619076425282296E-01
b =  3.3269001508780827E-01

The "b" term is the scaling exponent: 0.333.
That is to say, in this small sample of hypothetical data, the LAD (a linear measure) scales with LV mass (a volumetric measure) to the 1/3 power.
Maybe that is just random.
Or, maybe that is just… cool.


Of course, selection of the best model depends on numerous factors some of which are the regression "fit" statistics and things like the "Bayesian information criterion". Excel won't report these bits, but ZunZun.com throws a bunch at you.

It's free, by the way- unlike the statistician's time.

Sunday, December 14, 2008

New Coronary Artery Z-Score Calculator

The folks over at Children's National Medical Center, Washington, D.C. (CNMC) have fired up their digital echo database: in a four month period, they sorted through over 400 eligible normal echos, and served up the largest analysis of normal coronary artery dimensions to date.

Their approach to the data analysis included explorations of the independent variables of BSA and height (and height, raised to the 2.7 power). Analysis of the varying independent measures and relationships demonstrated that the "best fit" model was the exponential model using BSA, or what is also known as the allometric model. Landing on this manner of analysis is not just fortuitous happenstance- numerous other investigations have come to the same conclusion regarding the scaling of cardiovascular structures. It is interesting to note that other recently published z-score data landed on a unique and quite different model (nonlinear polynomial fit).

Considering their allometric model, the scaling exponents of each of the coronary arteries calculated in this analysis are quite similar, but are not identical. Also, the scaling exponents are all very near 0.4-- not 0.5 as might be predicted by the theory of dimensional consistency (linear measurement of the coronary artery scaled to body surface area, i.e., cm vs. cm2). Actually, this comes as no surprise, given that the true nature of the relationship is (probably) a complex cascade between lean body mass, cardiac output, wall tension, and LV mass. Imperfect estimations of BSA are only peripherally related to some of these factors. It makes me wonder what the relationship would look like if we scaled/standardized the coronary artery diameters to LV mass instead of BSA.

Comparing this data to prior work, the authors note a very close correlation with the data from Boston, and they very politely admit some similarities to the data from Singapore (although, to be fair to the Singapore analysis it should be noted that they sought to make an internally standardized reference- indexing to the aorta- and thus their treatment of the relationship to BSA is not very robust). The authors have already done their own "smackdown" and their graphic comparison of the CNMC and Boston data is unsurprising. Moreover, the models and scaling exponents are remarkably similar. Here are the two LMCA prediction equations:

CNMC*:

 eqn8614

Boston:

 eqn8613 


* note: the CNMC equation is the alternate/equivalent form of their published equation: ln(M) = beta1 + beta2 x  ln(BSA)

If we discount the Boston y-intercept of -0.02887, as being so small as to be very nearly zero ( or, "not significantly different from zero"), the equations become all the more similar. We are then left with the primary difference between the z-score predictions being: the manner in which they deal with variance. The Boston group attempts to predict the standard deviation by a second regression equation, and the CNMC group takes the approach, now currently in vogue, of substituting the regression RMSE as the SD. The validity of either approach could(should?) probably be debated…

In the words of the authors:

Having a readily available Z-score calculator will be invaluable

Give it a go at ParameterZ.com.

I admit to taking a few liberties with this calculator: I convert the measurements to mm; I use the Haycock BSA formula rather than DuBois & DuBois (can't we just agree to do this already?); I use the 5th and 95th percentiles (± 1.65 SD's) for the limits on the range of normal values.


Coronary Artery Z Score Regression Equations and Calculators Derived From a Large Heterogeneous Population of Children Undergoing Echocardiography.
Laura Olivieri, Bob Arling, Mark Friberg, Craig Sable. Journal of the American Society of Echocardiography December 2008 (Article in Press DOI: 10.1016/j.echo.2008.11.003)
Theoretical and empirical derivation of cardiovascular allometric relationships in children.
Sluysmans T, Colan SD. J Appl Physiol. 2005 Aug;99(2):445-57. Epub 2004 Nov 19.
Allometric analysis of the association between cardiac dimensions and body size variables in 464 junior athletes.
George K, Sharma S, Batterham A, Whyte G, McKenna W. Clin Sci (Lond). 2001 Jan;100(1):47-54.
Derivation of a size-independent variable for scaling of cardiac dimensions in a normal adult population.
Neilan TG, Pradhan AD, Weyman AE. J Am Soc Echocardiogr. 2008 Jul;21(7):779-85. Epub 2008 Mar 10.
Does size matter? Clinical applications of scaling cardiac size and function for body size.
Dewey FE, Rosenthal D, Murphy DJ Jr, Froelicher VF, Ashley EA. Circulation. 2008 Apr 29;117(17):2279-87. Review.
Regression Equations for Calculation of Z Scores of Cardiac Structures in a Large Cohort of Healthy Infants, Children, and Adolescents: An Echocardiographic Study.
Pettersen MD, Du W, Skeens ME, Humes RA. J Am Soc Echocardiogr. 2008 Aug;21(8):922-34. Epub 2008 Apr 11.
A Novel Method of Expressing Left Ventricular Mass Relative to Body Size in Children.
Foster BJ, Mackie AS, Mitsnefes M, Ali H, Mamber S, Colan SD. Circulation. 2008 May 27;117(21):2769-75. Epub 2008 May 19.
Coronary artery involvement in children with Kawasaki disease: risk factors from analysis of serial normalized measurements.
McCrindle BW, Li JS, Minich LL, Colan SD, Atz AM, Takahashi M, Vetter VL, Gersony WM, Mitchell PD, Newburger JW; Pediatric Heart Network Investigators.
Circulation. 2007 Jul 10;116(2):174-9. Epub 2007 Jun 18.
Coronary normograms and the coronary-aorta index: objective determinants of coronary artery dilatation.
Tan TH, Wong KY, Cheng TK, Heng JT. Pediatr Cardiol. 2003 Jul-Aug;24(4):328-35. Epub 2002 Sep 25.

Saturday, July 21, 2007

Coronary Artery Z-Score Calculator

Coronary Artery Involvement in Children With Kawasaki Disease, just published in this month's Circulation, contains a Z-Score gem: updated prediction equations for coronary arteries. These new prediction equations provide one major advantage over the equations of de Zorzi et al.: they account for the tendency towards non-constant variance, i.e. heteroscedasticity. It is interesting to note that, based on prior work in 2005, one might have expected the prediction equations to be linear regressions based upon the square root of body surface area (BSA raised to the 0.5 power). Instead, the prediction equations are nonlinear and relate to the BSA raised to the 0.3xxx power...
Perhaps the coronary artery system is different enough in structure and function that it does not obey the same rules for parent/daughter vessels in the remainder of the arterial tree. On a more practical note, the authors excluded the left main coronary artery from their analysis, noting:

normal anatomic variations make its interpretation less reliable

The normal variation of the coronary arteries includes such arrangements as left-dominant and right-dominant systems, long and short main coronary artery segments, and even separate origins of the circumflex and anterior descending coronary arteries, to the exclusion of the left main altogether. I doubt that this point gives us a hall pass to abandon measuring the left main coronary artery in our Kawasaki patients, but it is certainly an important observation.

Check out the new and improved Kawasaki Disease Coronary Artery Z-Score calculator here: