Showing posts with label LV Mass. Show all posts

Thursday, April 4, 2013

Lean body mass as a scaling variable in pediatric cardiology

lean body mass prediction equations based on height, weight, age, and gender are now available, providing insights into the practice of scaling of cardiovascular parameters to body size.
Recent critical reviews of reference values for pediatric cardiology are frankly sobering: we don’t have many studies with sufficient numbers of patients to draw reasonable conclusions, and the statistical methods are, at times, specious. I considered writing my own critical review of these critical reviews, but that just felt, well, a bit too meta. Please read this critical review of the many methodological limitations,  and this critical review of the statistical methods used in developing the current reference values. These are harsh but honest assessments of the current state of the art. Considering the criticism leveled against the community, it’s enough to make one wonder if anyone out there is even trying to generate worthwhile reference data.
Clearly, some folks are.
Canadians, mostly, by the looks of things.

background

Since the very first time a pediatric cardiologist realized that babies weren’t just tiny adults, and that their hearts are small but proportional to their bodies, we have been in a struggle to figure out how best to adjust for body size. The usual suspects have all been tried, with varying success: age, height, weight, body surface area, various allometric exponents of the same... Some groups advocate that weight alone is the best scaling variable; others argue convincingly that height is better; other groups go back-and-forth between the two (see the works from Mass General: 2009 and 1992 ).
Combining both height and weight, BSA has proven to be quite good as a scaling variable, with a defensible theoretic and empiric case for it’s use (see Sluysman and Colan, JAP 2005). But why should cardiac size scale with height, or weight, or BSA? What is the underlying physical principle that says heart size should be proportional to height? Could it be because tall people breathe thinner atmosphere? Because heavy people have to deal with more friction?
Lean body mass (or “Fat Free Mass”-- our brain, bones, and primarily, muscles) are what demand oxygen. If we were insects, we would just get our oxygen by moving the air right through our little exoskeletons. But most of us are not insects, and we get our oxygen instead via red blood cells, transported through our vast network of tubes, pumped from the heart. The heart has developed to pump oxygenated blood to the tissues that need it.
Thank you very much, Captain Obvious” you say.
But there it is: the heart scales with lean body mass.
Yet, we don’t measure lean body mass. Nobody in the echo lab measures LBM. In fact, it’s a rare person in the echo lab that even knows how to measure it.
Traditionally, measurement of LBM required specialized equipment and training. Personally, I have never seen a pair of skinfold calipers in the cardiology department, and a dunk tank is almost entirely out of the question. I keep thinking a bioelectric impedance tool would somehow magically grow into this role, but I have yet to see that happen. Technically, I think you could measure it in the MRI scanner, but DEXA is probably the gold standard, and I am pretty sure we don’t have one of those machines on campus.
Height and weight (and BSA) may be poor surrogates for LBM, but at least they are easy to measure.

recent work

In the May-June issue of Annals of Human Biology, Foster et al. tackle the idea of developing a series of equations that could predict lean body mass from easily measured anthropometric measures. They measured lean body mass on over 800 children (using DEXA) and then performed some statistical kung-fu to develop their equations... and then validated those equations on another 300 or so patients. Using their prediction equations will get you within 5% of measured lean body mass, a feat that is about on par with some other available measurements (?bioelectric impedance??)
LBM estimated using this simple and inexpensive method may be useful in a variety of settings including ... characterization of the appropriateness of physiologic parameters that scale well to LBM such as resting energy expenditure, heart size, kidney function and drug dosing.
In an article in the current issue of JASE, the same group now apply these new lean body mass prediction equations to the age-old question of how best to determine left ventricular hypertrophy, a matter which they had previously covered and if I might add, raised the bar once already. They go on to demonstrate that— compared to values adjusted for lean body mass— height-adjusted LVM frequently over-estimates the incidence of LVH, and conversely, that BSA-adjusted values frequently under-estimate LVH (though less so than with height) They conclude the present investigation:
LBM is likely the best scaling variable and may be estimated reasonably accurately in children aged 5 to 21 years.
Only by scaling LV mass to LBM will we be able to determine the impact of obesity on heart size.

future directions

I think the ability to estimate LBM is going to be important to the field of reference values for echocardiography. It is, in effect, the holy grail of scaling variables for pediatric cardiology, and cardiology in general.
I believe that this is going to be so important to future research, I want to help you calculate lean body mass on your own data:

http://dev.parameterz.com/lbm/

In an effort to be completely transparent about the calculations, I have also provided a step-by-step worked example lean body mass calculation:

http://dev.parameterz.com/lbm/walkthrough/

And finally, a way to batch-process your data, adding lean body mass by the droves (upload your own csv data)

http://dev.parameterz.com/lbm/upload/

Wednesday, November 11, 2009

Skew in Echocardiographic Reference Data

some offhand observations about the treatment of skewness in pediatric echo reference data.

Skewness:
1. asymmetry in a frequency distribution.
2. a measure of such asymmetry.

SkewedDistribution

Underlying the use of z-scores is an assumption about the symmetric nature of the distribution: the use of "Z" is because the normal distribution is also known as the "Z distribution". However, as noted elsewhere[1, 2], cardiac growth data are skewed to the right. Here are a few examples that I find remarkable.

Left Atrial Diameter

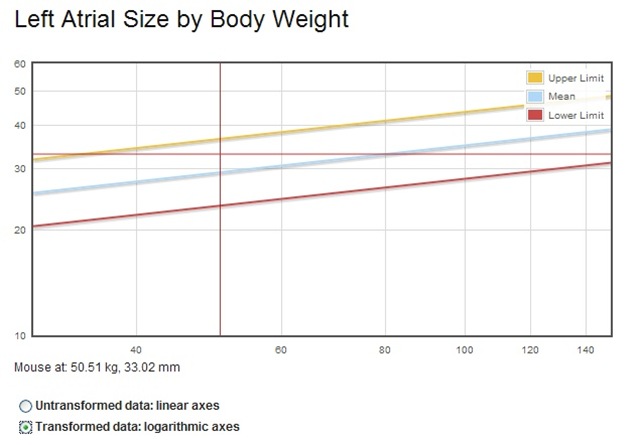
Neilan et al.[3] examined the nature of the relationship of body size to cardiac structures using the left atrial diameter as measured in over 15,000 normal patients. Their plot of LA diameter against body weight—and the underlying rightward skew—can be examined here: left atrial diameter vs. body weight. Although the chart is presented in the source article with logarithmic axes, "back transforming" the axes into natural units reveals the magnitude and direction of the skew.

left_atrial_diameter_vs_body_weight

Left Ventricular Mass

Using the LMS technique to deliberately account for skew (and non-constant variance), Foster et al.[4] provide the data used to construct the following curves: left ventricular mass vs. height (I used ±1.65 for the upper and lower bounds). Interestingly, while the LMS method handles the skew and variance in a discrete (although smoothed) fashion, applying a log transformation appears to control both phenomenon as well.

lv_mass_vs_height_plot

Fetal Data

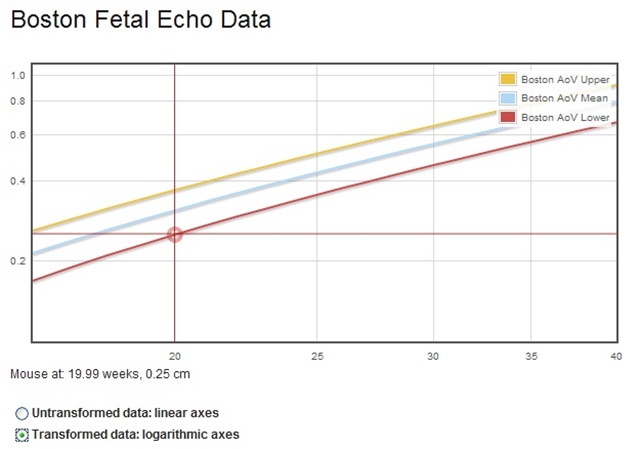
Comparing the recently published[5] fetal echo z-score data with the earlier reference[6] reveals one obvious difference: the Boston data is modeled as having a normal distribution, with no obvious skew. What, I wonder, happens if the underlying data really does have rightward skew, but is modeled as a normal distribution? Hmm...

fetal_skew


References

  1. Sluysmans T and Colan SD (2009). Structural Measurements and Adjustment for Growth. In Wyman Lai [et al.] (Eds.), Echocardiography in Pediatric and Congenital Heart Disease: From Fetus to Adult . Oxford: Wiley-Blackwell
  2. Abbott RD, Gutgesell HP. Effects of heteroscedasticity and skewness on prediction in regression: modeling growth of the human heart.
  3. Neilan TG, Pradhan AD, Weyman AE. Derivation of a size-independent variable for scaling of cardiac dimensions in a normal adult population.
  4. Foster BJ, Mackie AS, Mitsnefes M, Ali H, Mamber S, Colan SD. A novel method of expressing left ventricular mass relative to body size in children.
  5. McElhinney DB, Marshall AC, Wilkins-Haug LE, Brown DW, Benson CB, Silva V, Marx GR, Mizrahi-Arnaud A, Lock JE, Tworetzky W. Predictors of technical success and postnatal biventricular outcome after in utero aortic valvuloplasty for aortic stenosis with evolving hypoplastic left heart syndrome.
  6. Schneider C, McCrindle BW, Carvalho JS, Hornberger LK, McCarthy KP, Daubeney PE. Development of Z-scores for fetal cardiac dimensions from echocardiography.

Thursday, June 4, 2009

LV Mass Reference Values: Smackdown

I am starting to think I should change the tagline for this blog to:
more questions than answers
I am in the midst of building another smackdown calculator:

LV Mass Smackdown

I hope that it use is self-explanatory and that it requires no introduction- because I am now out of time (heading out to the ASE meeting!).
This is still a 'work in progress' (I seem to have lots of these). Upon my return from the nation's capitol, I plan to add additional functionality:
  • tips on measurement technique
  • input validation
  • automatically detecting discrepancies between references
  • allowing users the opportunity to provide feedback in the cases where there are discrepancies
I think this is going to be very interesting ...

Tuesday, January 13, 2009

Line Fitting for Pediatric Cardiology (and everyone else)

Described as "one of the fundamental tasks of scientific inquiry", model selection could consume the better part of an afternoon and an important part of one's budgeted time with a statistician.

Enter ZunZun.com.

If you're looking for quality curve fitting and surface fitting, this is the site for you!

The power law applied by Sable et al. in their description of coronary artery reference values caught my attention. Particularly, the scaling exponents for the individual coronary arteries are all different, and not what I would have intuitively guessed them to be, based on the principle of geometric similarity. So, I wanted to test a theory: perhaps the coronary arteries scale well with something besides BSA.

Consider this small data set of 10 hypothetical patients:

Ht (cm) WT (kg) BSA (Haycock)
57 6.1 0.3187
61 7 0.3525
83 12.6 0.5464
98 14.2 0.6223
104 16.6 0.6930
120 20.5 0.8215
148 41 1.2961
172 88.6 2.0820
176 58 1.6729
178 65.5 1.7940

From this I predicted the diameter of the LAD and height-based LV mass for each hypothetical subject.
I then constructed a second table of super hypothetical data:

LV Mass (g) LAD (mm)
16.86 1.38
19.19 1.44
34.42 1.72
45.69 1.82
50.17 1.90
63.28 2.04
99.64 2.46
149.46 2.99
158.99 2.73
163.79 2.81

Then I did some line fitting:

hypothetical LAD vs. LVM

The model fitted is:

y = a * xb

The reported coefficients are:

a =  5.2619076425282296E-01
b =  3.3269001508780827E-01

The "b" term is the scaling exponent: 0.333.
That is to say, in this small sample of hypothetical data, the LAD (a linear measure) scales with LV mass (a volumetric measure) to the 1/3 power.
Maybe that is just random.
Or, maybe that is just… cool.


Of course, selection of the best model depends on numerous factors some of which are the regression "fit" statistics and things like the "Bayesian information criterion". Excel won't report these bits, but ZunZun.com throws a bunch at you.

It's free, by the way- unlike the statistician's time.

Wednesday, December 31, 2008

2D Area-Length LV Mass Calculator

I much prefer the 'ellipse tool' to the default method of tracing borders with the trackball. Plus, it is quick, pretty, and is more consistent with the principle behind the calculation.


Notes:

  • Measure at end diastole (End diastole can be defined at the onset of the QRS, but is preferably defined as the frame after mitral valve closure or the frame in the cardiac cycle in which the cardiac dimension is largest.)
  • Measure areas at the midventricular short axis view, at the level of the papillary muscle tips- generally the widest short axis diameter.
  • Measure the LV length from apex to plane of MV annulus, in A4C or A2C (largest) It is recommended that the basal border of the LV cavity area be delineated by a straight line connecting the mitral valve insertions.
  • Z-Scores are 'off label' (source article used M-Mode derived LV mass)

Recommendations for Chamber Quantification, JASE, December 2005
Recommendations for Quantification of the Left Ventricle by Two-Dimensional Echocardiography, JASE, 1989
A novel method of expressing left ventricular mass relative to body size in children.
Foster BJ, Mackie AS, Mitsnefes M, Ali H, Mamber S, Colan SD.
Circulation. 2008 May 27;117(21):2769-75.

Wednesday, October 22, 2008

Designing a Pediatric Echo Database

Having trolled the literature in an effort to consume and digest what has already been published in the name of "Pediatric Echo Normal Values" and "Pediatric Echo Reference Values" I have come to the conclusion that what I really wanted was this: a common collection of normative data, from which we could all draw our own conclusions.

That doesn't exist.

Yet.

There now appears to be growing and international interest in the matter of a common source of reference data for pediatric echo. An editorial (ePub ahead of print) in the  European Journal of Echocardiography now is calling for:

immediate discussions of a universal standard...
a concerted and collaborative international approach...
a single study to allow z-score computation...
a robust set of normal values, derived from a large number of individuals...

I hope the European Society of Echo plans on discussing this similar matter with the American Society of Echo (or vice-versa) before things get too far along...

While it is looking like this project is in much more capable hands than my own (thankfully!), had I to do it myself it was going to be guided by one thing: data transparency.

Show me the data

After having read some of the literature, I would occasionally find myself wondering "What if they had used a different BSA equation?", or "what if they had used height instead?" or used a different regression model, etc. For myself, I would love to see some of the studies re-done, but just slightly different.

Of course, nobody is going to do that— re-calculate their regressions— just because I, or you, want to see it done with our own particular and fanciful bias. And that is the point of a full disclosure database: DIY if you don't like this flavor. And, increasingly, I think that people will want to do just that. As an example, there is a preponderance of evidence that BSA, height, and weight are all inadequate for the purpose of scaling:

The cardiovascular system has evolved for effective distribution of metabolic substrates to tissue with high metabolic potential (Circ. 2008)

Cardiovascular structures scale with cardiac output and lean body mass.

In a very practical sense, there is no way to measure lean body mass (LBM) in the echo lab so the need for a good surrogate remains. Foster et. al., have already hinted at the concept of re-combining height and weight to better estimate lean body mass:

The combination of height and weight may provide a better surrogate for lean body mass than height alone, which could result in a superior prediction... This approach differs from normalization for body surface area; although body surface area equations include both height and weight, the particular combination of height and weight is lost once the surface area calculation is done.

Without providing open access to collected variables, like height and weight, any future data collection/analysis risks becoming irrelevant as our understanding of scaling cardiovascular structures evolves.

Show me more data

One of the biggest problems (IMHO) with the current approach to reference values is related to the matter of prediction. Different authors have proposed various methods of trying to predict the mean value of a given structure for a given body size, and these authors have similarly varied approaches to predicting the standard deviations. Understanding the relationship of the structure to body size is profound- and obviously important- but it is a different matter to determine if your measurement is normal- or not. For the purposes of reference values, the precise relationship of cardiac structure to body size doesn't matter.

At its essence, a z-score has nothing to do with regression equations. Whenever we make an echocardiographic measurement, and consider its "normality" all we are really asking is "how does this measurement compare to the same measurement of normal subjects with similar size ?" That is, what is the mean and standard deviation of the same structure measured in a large group of similar-sized normal subjects?

The exact relationship and regression doesn't matter- as long as we have a collection of enough data on similar-sized subjects. What is required, though is... an awful lot of data, grouped in a meaningful way. The number of required subjects is daunting: grouped the way they did in their study (by height), an LV Mass reference database modeled after Foster et al., should probably have tens of thousands of subjects: 145 groups (47 to 191 cm, in 1 cm increments) x 100-200 subjects in each group (although, I would think the increment could safely be increased to 2 cm, thereby cutting the number of groups in half). This is why there is so much in the way of prediction: you need fewer patients. In spite of the huge numbers required, the study by Foster et al., is, or probably should be, the model for the future of echocardiographic reference values.

Even More Data

In the same way that our understanding of scaling of cardiovascular structures is evolving (height vs. BSA vs. LBM) , so too is our ability to measure these cardiovascular structures. Similar databases of reference values for the various Doppler modalities and 3D echo measures should be taken into consideration.

The architecture of this database could have long lasting effects. Designing a large database of common reference measurements for data transparency will allow us to continually make the most intelligent use of the tremendous effort required to collect this data.


Normalization of echocardiographically derived paediatric cardiac dimensions to body surface area: time for a standardized approach.
Kaski JP, Daubeney PE.
Eur J Echocardiogr. 2008 Sep 30. [Epub ahead of print]
Does size matter? Clinical applications of scaling cardiac size and function for body size.
Dewey FE, Rosenthal D, Murphy DJ Jr, Froelicher VF, Ashley EA.
Circulation. 2008 Apr 29;117(17):2279-87. Review.
A novel method of expressing left ventricular mass relative to body size in children.
Foster BJ, Mackie AS, Mitsnefes M, Ali H, Mamber S, Colan SD.
Circulation. 2008 May 27;117(21):2769-75. Epub 2008 May 19.
Interpretation of echocardiographic measurements: a call for standardization.
Vasan RS, Levy D, Larson MG, Benjamin EJ.
Am Heart J. 2000 Mar;139(3):412-22.

Saturday, July 19, 2008

LV Mass Z-Scores

"...these could easily be included in echocardiography software, which would allow automated generation of an LV mass-for-height z score and percentile for each child undergoing echocardiography."


A Novel Method of Expressing Left Ventricular Mass Relative to Body Size in Children [link]

Bethany J. Foster, MD, MSCE; Andrew S. Mackie, MD, SM; Mark Mitsnefes, MD; Huma Ali;
Silvia Mamber, MD; Steven D. Colan, MD

Circulation. 2008;117:2769-2775 Published online before print May 19, 2008


Apart from debunking the practice of simply indexing LV mass by dividing mass by height, the "novel method" is the LMS (lambda, mu, sigma) method of analysis. While I couldn't paint my way out of a Box-Cox transformation, I get the idea: the lambda (power transformation to deal with skew), mu (mean), and sigma (coefficient of variation) are determined for each of many groups, elegantly- and deliberately- addressing the matters of skewness and heteroscedasticity.


Lots to read up on with this technique:


  • The LMS method for constructing normalized growth standards [link]
  • Smoothing reference centile curves: the LMS method and penalized likelihood [link]
  • download LMS chart-making software from Tim Cole's website

The authors acknowledge that their data should not be taken to represent the definitive model of LV mass reference values, only that they are proposing the LMS technique as an alternate, superior, method.


Note: LV Mass was estimated from m-mode using the Devereux equation.


LV Mass Z-Score Calculator