Showing posts with label Fetal. Show all posts

Friday, March 23, 2012

Fetal Tissue Doppler Z-Scores

Reference values and z-score calculations for fetal tissue Doppler E, A, and S waves added to new fetal echo z-score app.

I just wrapped up the design and implementation of a new fetal echo z-score site (fetal.parameterz.com) and as a test of the new modular design, I added the fetal tissue Doppler data from this recent article:

Gestational age- and estimated fetal weight-adjusted reference ranges for myocardial tissue Doppler indices at 24-41 weeks' gestation.
Comas M, Crispi F, Gómez O, Puerto B, Figueras F, Gratacós E.
Ultrasound Obstet Gynecol. 2011 Jan;37(1):57-64.

Although the article provides equations that adjust for fetal weight, since no pediatric cardiologist has ever asked me to estimate the fetal weight *wipes brow*, I have only included the gestational age-adjusted equations.

Jumping ahead for just a second, here is an example of the results page:

screenshot of fetal z-score app: results

fetal tissue Doppler z-scores for a 28wk4d fetus

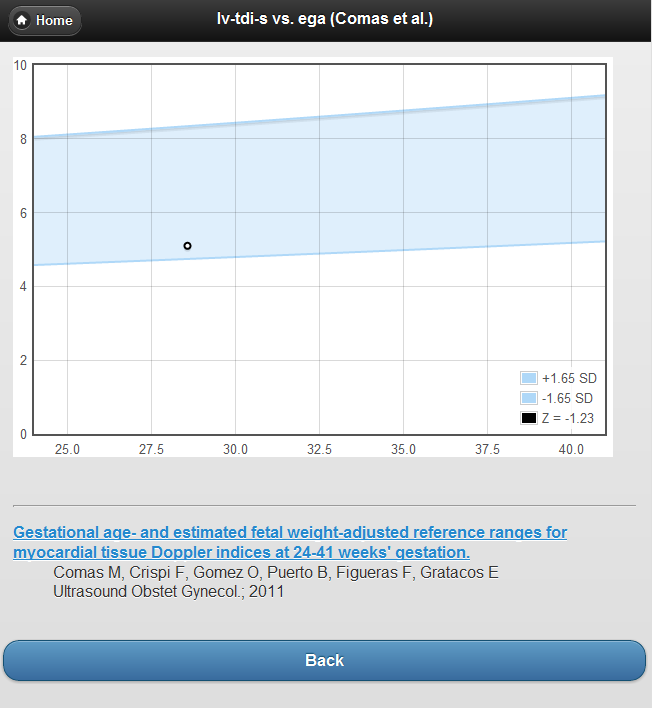
and here is an example chart:
screenshot of fetal z-score app: TDI plot

fetal tissue Doppler LV TDI S vs. EGA

Challenges

Implementing a class that provided a common interface for calculating a mean, range, and z-score was non-trivial for this reference. There are no fewer than 5 distinct models that govern the E’, A’, and S’ calculations:

  1. linear model with constant variance
  2. linear model with non-constant variance
  3. log-linear model with constant variance (log-normal)
  4. log-linear model with non-constant variance (NOT log-normal ?)
  5. log-polynomial model with non-constant variance (NOT log-normal?)

A second challenge was getting my calculations (based on the published data) to reconcile with the supplemental material (an Excel spreadsheet). In a few instances the spreadsheet used data with more significant digits than in the article, and in a few other instances the spreadsheet incorrectly exponentiates the “standard deviation” term. In the end, I figured that I had to go with the published data over the supplemental data. Also, it became clear after referring to the charts that the spreadsheet data was incorrect.

Concerns

Apart from the multiple models and the occasional inconsistency in the formulae, there is also the small matter of the article failing to provide the typical correlation coefficients for the models, and, therefore, necessarily omitting the “R-squared” values. The R2 tell us about the goodness-of-fit or, sometimes, how much of the variance is explained by the model. For some of the dependent variables this seemed like an important omission as the models appear promising. I have included the data for the E’, A’, and S’ because they do look somewhat promising. I did not include the data for the derived values like the E’/A’,  E/E’ ratios or the MPI calculations because, to me, they seem dodgy—particularly without an R2.

Summary

  1. New fetal echo z-score calculator
  2. New calculations for fetal tissue Doppler
  3. I welcome your comments and criticisms

Sunday, January 3, 2010

New Fetal Echo Z-Score References

New fetal cardiac z-score equations from William Beaumont Hospital; new online calculator at OBSONO.org

Following up on their abstract from earlier this year, the group at William Beaumont Hospital in Royal Oak, Michigan produced what turns out to be the largest cross-sectional study of normative data for fetal cardiac measurements of all time:

Fetal echocardiography: z-score reference ranges for a large patient population.
Lee W, Riggs T, Amula V, Tsimis M, Cutler N, Bronsteen R, Comstock CH.
Ultrasound Obstet Gynecol. 2010 Jan;35(1):28-34.

Data from over 2700 normal pregnancies was used to construct z-score equations for the following fetal cardiac measures:

  • LV minor
  • RV minor
  • Aortic annulus
  • Pulmonary annulus
  • Cardiac circumference

By way of comparison, the previous work from Royal Brompton used data from 130 normal pregnancies; the more recent "unpublished" equations from Boston are based on observations made on 232 normal pregnancies. This new data eclipses both of these studies by at least an order of magnitude. For the purpose of generating normative data, "n" is everything, so statistically speaking, this study is HUGE.

The William Beaumont z-score equations deal with the prediction of the standard deviation in a manner similar to that used by the Boston folks, by a separate regression, thus deliberately accounting and controlling for the natural spread of data (heteroscedasticity). And, for what has to be one of the first, if not only, time- the authors also present a beautiful frequency vs. residuals plot and convincingly demonstrate that their data conforms to a normal distribution- a predicate for all z-score comparisons.

To better examine the differences and similarities of the various z-score equations I provide these tools, allowing for side-by-side comparison of the predicted z-scores, mean values, and normal ranges:

Fetal Aortic Valve Z-Score Comparison

smackdown-aov

Fetal LV Minor Z-Score Comparison

smackdown-lv

The authors also provide their own online fetal cardiac z-score calculator ( one-upping ParameterZ.com by generating pretty z-score plots ! ) at  www.obsono.org.


Speaking from the perspective of a pediatric cardiac sonographer, I have to recognize and thank the authors of this study for doing the work that we cannot do. Those of us in pediatric cardiology do not see a high volume of unselected, normal pregnancies and thus could never generate this kind of normative data.

Wednesday, November 11, 2009

Skew in Echocardiographic Reference Data

some offhand observations about the treatment of skewness in pediatric echo reference data.

Skewness:
1. asymmetry in a frequency distribution.
2. a measure of such asymmetry.

SkewedDistribution

Underlying the use of z-scores is an assumption about the symmetric nature of the distribution: the use of "Z" is because the normal distribution is also known as the "Z distribution". However, as noted elsewhere[1, 2], cardiac growth data are skewed to the right. Here are a few examples that I find remarkable.

Left Atrial Diameter

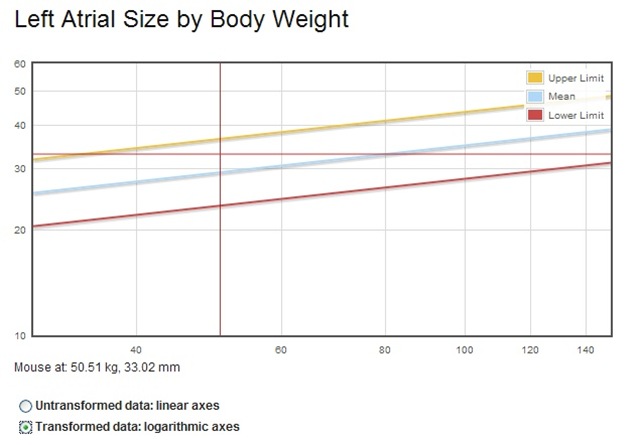
Neilan et al.[3] examined the nature of the relationship of body size to cardiac structures using the left atrial diameter as measured in over 15,000 normal patients. Their plot of LA diameter against body weight—and the underlying rightward skew—can be examined here: left atrial diameter vs. body weight. Although the chart is presented in the source article with logarithmic axes, "back transforming" the axes into natural units reveals the magnitude and direction of the skew.

left_atrial_diameter_vs_body_weight

Left Ventricular Mass

Using the LMS technique to deliberately account for skew (and non-constant variance), Foster et al.[4] provide the data used to construct the following curves: left ventricular mass vs. height (I used ±1.65 for the upper and lower bounds). Interestingly, while the LMS method handles the skew and variance in a discrete (although smoothed) fashion, applying a log transformation appears to control both phenomenon as well.

lv_mass_vs_height_plot

Fetal Data

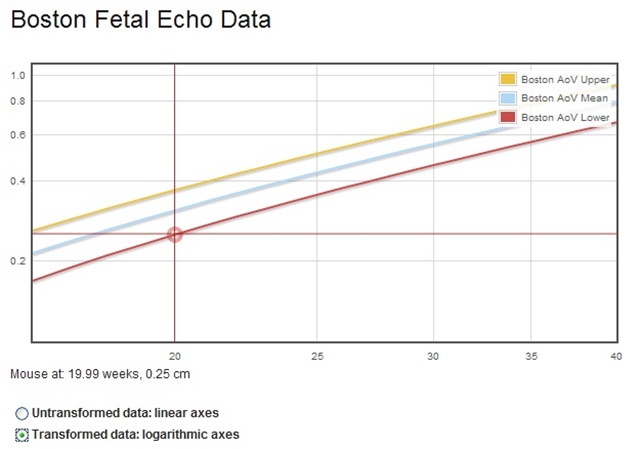
Comparing the recently published[5] fetal echo z-score data with the earlier reference[6] reveals one obvious difference: the Boston data is modeled as having a normal distribution, with no obvious skew. What, I wonder, happens if the underlying data really does have rightward skew, but is modeled as a normal distribution? Hmm...

fetal_skew


References

  1. Sluysmans T and Colan SD (2009). Structural Measurements and Adjustment for Growth. In Wyman Lai [et al.] (Eds.), Echocardiography in Pediatric and Congenital Heart Disease: From Fetus to Adult . Oxford: Wiley-Blackwell
  2. Abbott RD, Gutgesell HP. Effects of heteroscedasticity and skewness on prediction in regression: modeling growth of the human heart.
  3. Neilan TG, Pradhan AD, Weyman AE. Derivation of a size-independent variable for scaling of cardiac dimensions in a normal adult population.
  4. Foster BJ, Mackie AS, Mitsnefes M, Ali H, Mamber S, Colan SD. A novel method of expressing left ventricular mass relative to body size in children.
  5. McElhinney DB, Marshall AC, Wilkins-Haug LE, Brown DW, Benson CB, Silva V, Marx GR, Mizrahi-Arnaud A, Lock JE, Tworetzky W. Predictors of technical success and postnatal biventricular outcome after in utero aortic valvuloplasty for aortic stenosis with evolving hypoplastic left heart syndrome.
  6. Schneider C, McCrindle BW, Carvalho JS, Hornberger LK, McCarthy KP, Daubeney PE. Development of Z-scores for fetal cardiac dimensions from echocardiography.

Monday, November 2, 2009

More Fetal Echo Reference Values

Seems like I spent most of the month of October thinking about fetal echos in one form or another. Apart from the earlier release of the Fetal Echo Z-Scores: Femur Length calculator, I also developed a couple of "helper" routines:

  • A calculator to cross-check the femur length against the EGA derived from dates. Also Gives reference values for fetal thoracic circumference:

    Fetal Biometry

  • A remake of the CHOP calculator- useful for describing the hemodynamic status of the recipient twin in twin-twin transfusion syndrome (TTTS). Good stuff for reminding me about the various manners in which heart failure can be categorized by fetal echo:

    CHOP Fetal CV Profile Score

  • A calculator for fetal LV/RV/IVS wall thicknesses. In the absence of any published z-score equations, these two sources (one uses autopsy data) seem to be our only recourse:

    Fetal Ventricular Wall Thickness Reference Values


Additionally, the October 13 issue of Circulation brought a new fetal echo z-score reference:

Predictors of technical success and postnatal biventricular outcome after in utero aortic valvuloplasty for aortic stenosis with evolving hypoplastic left heart syndrome.
McElhinney DB, Marshall AC, Wilkins-Haug LE, Brown DW, Benson CB, Silva V, Marx GR, Mizrahi-Arnaud A, Lock JE, Tworetzky W.
Circulation. 2009
Oct 13;120(15):1482-90. Epub 2009 Sep 28.

I won't attempt an analysis beyond the smackdown itself because, as the authors reveal, these new z-score equations are based on

unpublished fetal norms…

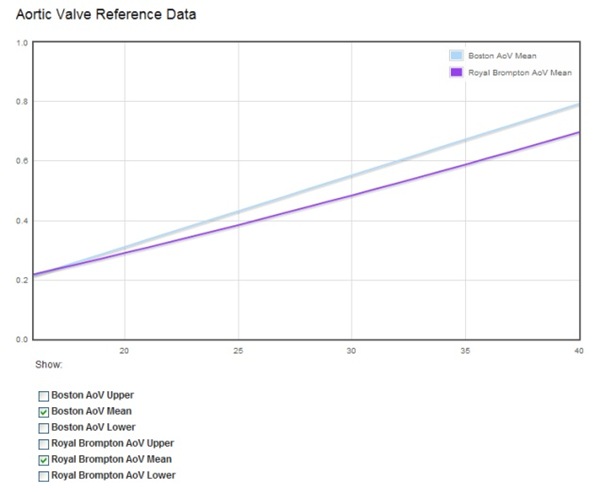
Still, it is interesting (to me) to see the data published at all, and I think the smackdown sheds some interesting light on the two groups of equations.

fetal_aov_plot

Tuesday, October 13, 2009

Fetal Echo Z-Score Calculator: Updated

Cardiac valve, chamber, and arch z-scores based on femur length; predicted LMP/EDD/EGA; LV/RV size discrepancy ratios.

This update provides the following functionality:

Fetal cardiac z-scores calculated from femur length

According to the source article, each of the independent variables (EGA, FL, BPD) had similar performance, with the regressions based on femur length being slightly superior. I have not yet compared the z scores across the two calculations- it is likely that minor differences exist between z-scores based on femur length, and those based on the derived EGA.

Femur length estimates of EGA, EDD, and LMP

Since the ICAEL guidelines require reporting of the EGA (and manner of determination), this is estimated according to this common citation: New charts for ultrasound dating of pregnancy. Without getting wrapped up in the subtleties of another field entirely, this reference seemed suitable . From the looks of it though, EGA predictions by femur length alone are open to some criticism.

Size discrepancy ratios

A common referral for fetal echocardiography is the discovery on routine ultrasound of a "size discrepancy" between the left and right ventricles. The authors of this new article Left Ventricle to Right Ventricle Size Discrepancy in the Fetus: The Presence of Critical Congenital Heart Disease Can Be Reliably Predicted suggest the use of easily calculated ratios as a simple manner for stratifying the various underlying lesions. Ratios of 0.6 for each of the sites (MV/TV, LV/RV, AoV/PV) appear to have good predictive value- particularly when used in combination with the transverse arch measurement and descriptions of the flow across the atrial septum.

The topic of z-scores is touched upon briefly with reference to the transverse arch. Although the data presented suggests that the arch z-scores were significantly different between groups (intervention vs. not), no cutoff values for the z-score are suggested. It is interesting (to me) that the stated z-scores in the intervention vs. non groups is –4.7 vs. –3.2 (or, the difference between the 0.0001 percentile and the 0.0687 percentile !!). If one uses the normal boundaries of the 5th and 95th cumulative percentiles (z-scores of ±1.65), or the more liberal 2.3-97.3 percentiles (z scores of ±2), even the non-intervention group seems way out there.

It is also interesting to me that the chamber size and valve z-scores weren't discussed- at all. Many of the referrals for 'size discrepancy' seem more imagined than real, and z-scores of the left heart structures ought to provide evidence of normality, even if things appear discrepant. Along those lines, I am looking forward to the manuscript to follow this abstract: Fetal Cardiac Growth: New Z-Score Ranges From 3,000 Normal Pregnancies.

You can find the updated z-score calculator here:

ParameterZ.com Fetal Echo Z-Score Calculator

Wednesday, February 18, 2009

Digital Imaging Protocols for Pediatric Echo

"Because."

This was the explanation I was given, very early in my introduction to "digital echo", about why we record These Views in This Order. At the time, I was coming from a lab that did things proper: starting with the subcostal views. The only sense this new "parasternal images 1st" protocol made was that it supposedly made reading the studies easier.
How convenient.

For you.


Who is this protocol for anyhow?

I insist that the marriage of the image acquisition protocol with the ordered reviewing of said images is a potential liability. Always starting with the parasternal view is fine for most hearts— most hearts are nearly normal. The problem, in my opinion, with starting with the parasternal view is: it presumes that things are normal, or are nearly normal, or that I can at least make something up to look passably normal.

If things are not normal (this is what we're supposed to be particularly good with in Peds, isn't it?) this type of protocol presumes too much: that I already know enough about the heart to make some sense of the parasternal views. Try this on: what is the PLAX view for a patient with dextrocardia, DORV, and pulmonary atresia supposed to look like? How about HLHS? In order to record meaningful parasternal long axis views of these types of abnormal hearts, the sonographer has to either:

  • immediately recognize the pathology from this one clip
  • spend time scanning from subcostals and apicals first (in order to sort it out) then return to the "starting point"- the parasternal views.

The first option is not a fair predicament for most sonographers (including physicians), and the second- grossly inefficient.

The Images are for Physicians

Certainly, I appreciate that in order to report the anatomy, arrangement, size, and function of the examined heart some considerable structure is required. There must be images that support and document our conclusions. And, as we are increasingly moving towards structured reporting, the structure of the underlying, supporting images must also evolve. I have no problem with this, in fact, I embrace it. It's the "absence of evidence is not evidence of absence" philosophy, taken to it's logical conclusion. We don't want anyone to report anything that our images can't substantiate. The fact that physicians will determine and require a certain, precise collection of images is undisputed. They may choose and prefer to review them in any particular order. Bully for them.
Our obligation is to provide these images.

I simply prefer to do it in a manner that is most efficient for me.

The Protocol is for Sonographers

What is really needed to improve our exam consistency is a system that allows for the flexible acquisition of any prescribed (minimum) set of images. On a small scale, we are already doing this with stress echo, particularly with exercise stress echo: you grab what you can, when you can, and sort it out later. The order of collection is irrelevant, but the presentation of the images, in order, is everything. I can't tell you how many fetal echos I have done that would have been greatly improved by the ability to collect the images as I saw them, and then sort them into a logical arrangement later. Not to mention every "new blue" dextrocardia-aortic-atresia-single-ventricle-goat-wreck (Goat Rodeo + Train Wreck, contracted form), I have done since the inception of the current "parasternals 1st" protocol.

I am eager to see what the new Philips iE33's SmartExams are all about.


Lately, I have been tinkering about with a collection of image acquisition protocols suitable for pediatric echo.
In addition to providing a basis for building our own structured, protocol-driven exams, I believe these could also turn into a fairly useful teaching tool (I still need more descriptions/images though).

Wednesday, June 11, 2008

Fetal Ventricular Wall Dimensions

Reference values for fetal ventricular wall thickness are not easy to come by. This gadget is based on one of few available references.

Evaluation of Fetal Heart Dimensions from 12 Weeks to Term
Cora Firpo, MD, Julien I.E. Hoffman, MD, and Norman H. Silverman, MD
Am J Cardiol 2001 [link]

Measurements of the ventricular walls and septum were made from the "4-chamber" views, below the coapted AV valve leaflets, in diastole.

Saturday, December 8, 2007

Fetal Echo Z-Scores: the SGA conundrum

actual size! The fetal echo z-score calculator was initially a proof-of-concept project (as were all of the calculators at ParameterZ.com). It has since proven itself to be quite useful, and I refer to it for nearly all fetal echos now.

However, a shortcoming of the current calculator is highlighted by this common referral:

  • SGA (Small for Gestational Age)
  • RV > LV
  • LV measures lower limits of normal for EGA

The real difficulty here of course, is the SGA baby. Based purely on dates, the baby is known to be small- and all measures of her cardiac structures are sure to be small as well.
Absolutely.
Small.

But can't her heart still be relatively normal

In the article Development of Z-scores for fetal cardiac dimensions from echocardiography, regressions are presented based on three independent variables: femur length, biparietal diameter, and EGA. According to the authors, "femur length gave the better correlation coefficient with fetal cardiac dimensions" though admittedly, all the independent variable gave good correlations. And a good discussion is made over EGA as a surrogate for fetal size, the importance of considering fetal size, fetal growth and fetal size, fetal size, fetal size, ...

So why don't I build the calculator based on the femur length- ergo the fetal size?

Because: I have now become an advocate of measuring the fetus:

  • measuring the BPD
  • measuring the head circumference
  • measuring the abdominal circumference
  • measuring the femur length

Now, I measure the fetal size and, taking advantage of the OB calculation package on the ultrasound machine, use the size-determined EGA- rather than the date-determined EGA.


The new and improved fetal echo worksheet allows you to edit the EGA and automatically update all of the z-scores based on your measurements. And, just for fun, makes estimations of the EDC and LMP.