Wednesday, December 21, 2011

CMR LVEDV Z-Score Mini-Smackdown

examining CMR references for LVEDV reveals interesting differences; doubt is cast upon the practice of generating z-scores for indexed values

I have been tinkering with z-scores for cardiac MRI and I thought it might be interesting to compare a couple of references for LV end-diastolic volume (I always think this stuff is interesting):

So, what I did was create some tables (using the mean and ± 2SD limits), generated some charts, and then made a series of z-score calculations over a range of LVEDV values for two hypothetical patients (view the spreadsheet and calculations for this data HERE).

Data:

First, the Alfakih data: based on their published values for “younger men” using SSFP, the LVEDVi is 87.6 ± 15.6.

LVEDV Reference Values: Alfakih et al.
BSA (m2) ULN (ml) Mean (ml) LLN (ml)
0.5 59 44 29
0.6 71 53 34
0.7 83 61 40
0.8 95 70 46
0.9 106 79 51
1.0 118 88 57
1.1 130 96 63
1.2 142 105 68
1.3 154 114 74
1.4 166 123 80
1.5 177 131 86
1.6 189 140 91
1.7 201 149 97
1.8 213 158 103
1.9 225 166 108
2.0 236 175 114

And then the Buechel data: based on their allometric equation, a * BSAb, and their published values for boys: a = 77.5, b = 1.38, and using the z-score form of

A mathematical equation, expression, or formula.
 Object name is 1532-429X-11-19-i1.gif

... and their published value for the “SD” = 0.0426

LVEDV Reference Values: Buechel et al.
BSA (m2) ULN (ml) Mean (ml) LLN (ml)
0.5 36 30 25
0.6 47 38 32
0.7 58 47 39
0.8 69 57 47
0.9 82 67 55
1.0 94 78 64
1.1 108 88 73
1.2 121 100 82
1.3 135 111 92
1.4 150 123 101
1.5 165 136 111
1.6 180 148 121
1.7 196 161 132
1.8 212 174 143
1.9 229 188 155
2.0 245 201 166


Charts:


Z-Scores:


Generated Z-Scores for Patient BSA = 0.7
LVEDV Z: Alfakih Z: Buechel
15 -4.3 -11.7
20 -3.9 -8.8
25 -3.4 -6.5
30 -2.9 -4.7
35 -2.5 -3.1
40 -2 -1.7
45 -1.5 -0.5
50 -1.1 0.6
55 -0.6 1.5
60 -0.1 2.4
65 0.3 3.2
70 0.8 4
75 1.3 4.7
80 1.7 5.3
85 2.2 6
90 2.7 6.5


Generated Z-Scores for Patient BSA = 1.4
LVEDV Z: Alfakih Z: Buechel
50 -3.4 -9.2
60 -2.9 -7.3
70 -2.5 -5.8
80 -2.0 -4.4
90 -1.5 -3.2
100 -1.1 -2.1
110 -0.6 -1.2
120 -0.1 -0.3
130 0.3 0.5
140 0.8 1.3
150 1.3 2.0
160 1.7 2.7
170 2.2 3.3
180 2.7 3.9
190 3.1 4.4
200 3.6 4.9


Summary

Buechel et al. sum it up nicely in their discussion:

cardiac volumes have a non-linear relation to body surface area, and since the exponential values are different for different cardiac parameters, it would not be appropriate to provide normal values simply indexed to BSA

The textbook Echocardiography in Pediatric and Congenital Heart Disease has an excellent and thorough description of the practice of “indexing”. Essentially, the problem boils down to this: for LVEDV, none of the assumptions for the relationship are met:

In order for the per-BSA method of indexing to work, three assumptions must be met. The relationship to BSA must be linear, the intercept of the regression must be zero, and the variance must be constant over the range of BSA.

If you had to choose a reference for LVEDV in children measured with cardiac MRI, I would have to wonder why anyone would not use the data from Buechel et al.— unless they just did not have those calculations handy.

Well, now they do:

cmr.parameterz.com

Saturday, October 29, 2011

BSA Methods and Cardiac Z-Scores

A spreadsheet comparing different BSA calculations on various patients-- and the resulting BSA-adjusted z-scores-- reveals negligible differences.

Can we compare z-scores from various references when the methods for calculating BSA are different? How?

If a given group of z-score equations are BSA adjusted, and a given patient has a different BSA depending on the BSA formula, how do you perform a comparison? Meaning, if equation A uses BSA formula x, and equation B uses BSA formula y, to what extent are differences in the z-scores due to differences in BSA?

Which then spawns these questions:

  • What is a clinically important difference in BSA?
    • a tenth of a meter2?
    • a hundredth?
    • a thousandth?!?
  • How many significant digits are important when comparing z-scores?

I made this spreadsheet in an effort to examine some of these questions.

(the example z-score equation is from Kaiser et al., JCMR 2008.)

Looking over this data, I totally agree with Dallaire and Dahdah, JASE 2011, who noted:

There was virtually no difference when Z-score equations were derived from BSA estimated with different equations, and misclassification was rare.

Sunday, June 26, 2011

Estimating Pulmonary Artery Pressure from Acceleration Time

Calculate PA pressure using pulmonary artery Doppler acceleration time.


Methods

Doppler interrogation of the pulmonary artery was performed in the parasternal short axis view, with the pulsed-wave sample volume placed at the annulus of the pulmonary valve. The acceleration time was defined as the interval between the onset of systolic pulmonary arterial flow and peak flow velocity.


Pulmonary Artery Acceleration Time Provides an Accurate Estimate of Systolic Pulmonary Arterial Pressure during Transthoracic Echocardiography.
Yared K, Noseworthy P, Weyman AE, McCabe E, Picard MH, Baggish AL.
J Am Soc Echocardiogr. 2011 Jun;24(6):687-92.

Saturday, March 19, 2011

Aortic Root Reference Values Charts

A little decoration for the aortic root z-score calculator: charts.

Charts add a little ‘sugar’ to the reporting of the aortic root z-scores, by adding an important visual element to the situation.

I have tinkered with charts for the aortic root before, with a few ‘smack-down’ pages, but this is the first large-scale incorporation of the charts with the z-score calculator (well, that’s not exactly true, I do have a cute little chart for the TAPSE z-score calculator. But as far a scale , goes-- this is bigger and better.)

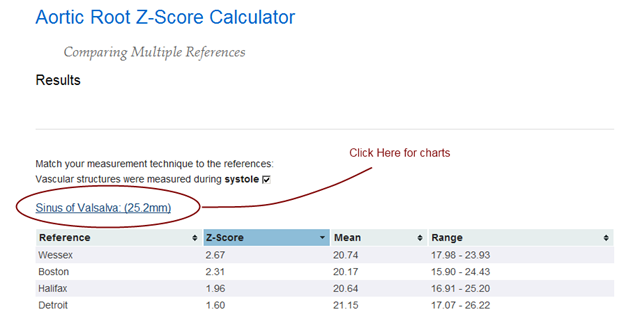
Now, when you see the results page from a z-score calculation, you can click on the sub-heading to link to a page with the appropriate charts for that patient:

aortic_root_charts_link

Clicking on the link illustrated in the above image takes you to these charts:

http://aoroot.parameterz.com/chart?site=sov&bsa=0.99&score=25.2

I took a small bit of design license in building these chart pages: I use the Haycock BSA formula for the patient’s BSA, even though it is not always (rarely?) the default equation used for the individual references. It made the difference between doing it in one sitting (OK, two), and probably not getting it done at all. It was just too complicated the way I had designed the base classes.

Sunday, March 13, 2011

Aortic Root and LV Volume Z-Score Calculators

Two new z-score calculators on Parameterz.com plus a paradigm shift or two

First, the z-score calculators:

  1. LV End-Diastolic Volume z-scores, using the 5/6 A-L method
  2. A consolidated Aortic Root z-score calculator

The paradigm shifts are these:

  1. All calculations are now server-side, using Python
  2. The Aortic Root calculator is a prototype for combining all available references into one calculator/results page


LV EDV Z-Score Calculator

These z-scores are based on the recent work Normal values for left ventricular volume in infants and young children by the echocardiographic subxiphoid five-sixth area by length (bullet) method, from the Feb 2011 JASE. This is a terrific approach to what is traditionally considered a difficult measurement to calculate and normalize. For one, ventricular volumes calculated by the traditional Simpson’s bi-plane technique are notoriously unreliable. To wit, the recent abstract from the PHN citing the 5/6 A-L technique as superioir:


Variability of LV size and function measurements in children with DCM is reduced when utilizing the 5/6 AL algorithm.

(Margossian et al., JASE; May 2010)

The authors cite their own previous work as demonstrating the 5/6 A-L technique to be valid with regards to correlating well with MRI volumes.

On another front, the equations presented in this article also dramatically simplify the very complex relationship of ventricular volume and size, thought to be multi-factorial based on ejection fraction, heart rate, cardiac output, and BSA. A theoretical allometric relationship between EDV and BSA was recently described to be approximately


...the predicted relationship is EDV ≈ BSA1.4

Theoretical and empirical derivation of cardiovascular allometric relationships in children.
Sluysmans T, Colan SD.
J Appl Physiol. 2005 Aug;99(2):445-57

The allometric relationship described in this article is with BSA1.38, which is, well, awesome.

The calculator itself is sort-of a hybrid calculator, in that the BSA and volumes are calculated with JS on the client, then the page is posted to the server and the z-scores are calculated using Python. Another novel aspect to this calculator is that, by virtue of the calculations being performed on the server, I can provide a running tab of recent calculations, resulting in a real-time plot of actual EDV vs. BSA data:

LVEDV vs. BSA

This is not the right calculator to be used for collecting normative data, but what I am learning about server-side programming-- like with this calculator-- is getting me much closer to realizing such a design.

Aortic Root Z-Score Calculator

This calculator is a combination of what I had learned from building the LVEDV calculator and from the prototype design of the multi-referenced coronary artery z-score calculator. The essence of the design is that the patient demographics and measurement data are entered once and the z-scores and reference ranges from each of several references are returned to you in what I hope is an easy  to use, sortable, results table:

http://aoroot.parameterz.com/calc?ht=128&wt=28&aov=15.5&sov=25&stj=18&aao=21

The data required to make the calculations are part of the url (i.e., the “query string”) so the results are essentially permanent and “linkable” should anyone find any need for such a feature.

The references for calculating aortic root z-scores use various BSA equations. This calculator applies the correct BSA formula to each calculation, and thus the z-scores between each reference should be comparable, even though the calculated BSA’s are slightly different. For posterity’s sake, the different BSA calculations are also provided, which therefore makes this a very elaborate BSA calculator:

http://aoroot.parameterz.com/calc?ht=128&wt=28

Also, since not all the references use the same measurement methodology, an allowance is made to show only the appropriate calculations based on your local methodology, i.e., I filter the results based on whether the user indicates the measurement of the vascular aspects of the aortic root were measured in systole or diastole.

To be sure, all of this could have been done on the client with JavaScript, but I thought it was time to grow up.