Friday, March 23, 2012

Fetal Tissue Doppler Z-Scores

Reference values and z-score calculations for fetal tissue Doppler E, A, and S waves added to new fetal echo z-score app.

I just wrapped up the design and implementation of a new fetal echo z-score site (fetal.parameterz.com) and as a test of the new modular design, I added the fetal tissue Doppler data from this recent article:

Gestational age- and estimated fetal weight-adjusted reference ranges for myocardial tissue Doppler indices at 24-41 weeks' gestation.
Comas M, Crispi F, Gómez O, Puerto B, Figueras F, Gratacós E.
Ultrasound Obstet Gynecol. 2011 Jan;37(1):57-64.

Although the article provides equations that adjust for fetal weight, since no pediatric cardiologist has ever asked me to estimate the fetal weight *wipes brow*, I have only included the gestational age-adjusted equations.

Jumping ahead for just a second, here is an example of the results page:

screenshot of fetal z-score app: results

fetal tissue Doppler z-scores for a 28wk4d fetus

and here is an example chart:
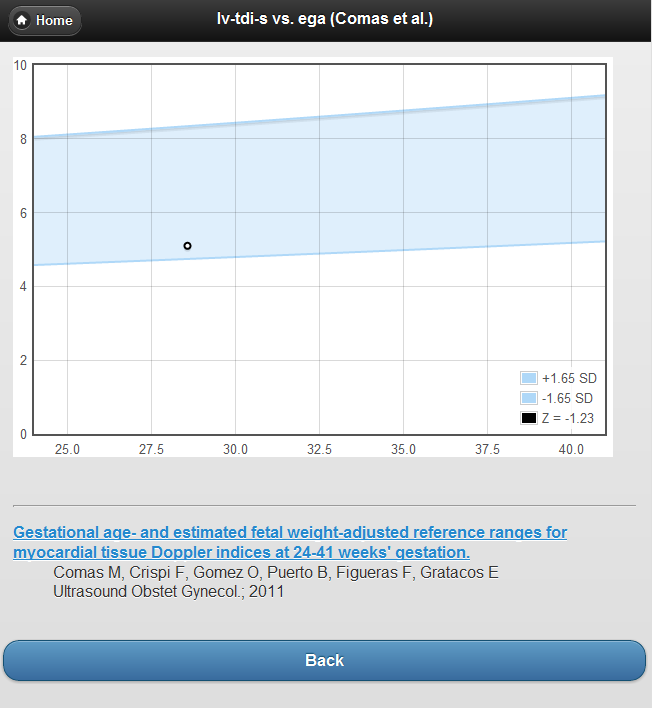
screenshot of fetal z-score app: TDI plot

fetal tissue Doppler LV TDI S vs. EGA

Challenges

Implementing a class that provided a common interface for calculating a mean, range, and z-score was non-trivial for this reference. There are no fewer than 5 distinct models that govern the E’, A’, and S’ calculations:

  1. linear model with constant variance
  2. linear model with non-constant variance
  3. log-linear model with constant variance (log-normal)
  4. log-linear model with non-constant variance (NOT log-normal ?)
  5. log-polynomial model with non-constant variance (NOT log-normal?)

A second challenge was getting my calculations (based on the published data) to reconcile with the supplemental material (an Excel spreadsheet). In a few instances the spreadsheet used data with more significant digits than in the article, and in a few other instances the spreadsheet incorrectly exponentiates the “standard deviation” term. In the end, I figured that I had to go with the published data over the supplemental data. Also, it became clear after referring to the charts that the spreadsheet data was incorrect.

Concerns

Apart from the multiple models and the occasional inconsistency in the formulae, there is also the small matter of the article failing to provide the typical correlation coefficients for the models, and, therefore, necessarily omitting the “R-squared” values. The R2 tell us about the goodness-of-fit or, sometimes, how much of the variance is explained by the model. For some of the dependent variables this seemed like an important omission as the models appear promising. I have included the data for the E’, A’, and S’ because they do look somewhat promising. I did not include the data for the derived values like the E’/A’,  E/E’ ratios or the MPI calculations because, to me, they seem dodgy—particularly without an R2.

Summary

  1. New fetal echo z-score calculator
  2. New calculations for fetal tissue Doppler
  3. I welcome your comments and criticisms

Sunday, March 4, 2012

The Problem with Indexing Volumes to BSA

Wherein the inappropriate indexation of cardiac volumes to BSA is explored, this time with charts!


For some time now I have been aware of and abiding by the following words of caution:
linear dimensions and volumes have a nonlinear relation to surface area and
are more appropriately indexed by surface area to the 0.5 and 1.5 power, respectively.

-- Gutgesell and Rembold, Am J Cardiol. 1990
But since I work mostly with echocardiography and echocardiography has, mostly, gotten this message I haven’t explored the problem much. Recently though, I have been reading some of the cardiac MRI literature. Plus, it’s hard not to see some reference to CMR even in the echo literature. A lot of the CMR literature seem to use a cutoff for ventricular chamber enlargement like:
170 ml/m2
And, in the search for improving the sensitivity of echo, many study designs pit echo measures against CMR measures.
So what is the problem?
What are the consequences of an inappropriate index?

I put together a few charts that helped me to understand the real hazards of what sounds like a mostly theoretical problem—maybe they will be useful to others as well:

RVEDV vs. BSA


This chart shows the expected nonlinear relationship between RVEDV and BSA: the predicted values (grey) and the somewhat arbitrary z-score upper limit of +4 (red) are those of Buechel et al.; the conventional cutoff values of 170ml/m2 are in yellow. Note that only at one place along the BSA spectrum is there an overlap of z-score and conventional indexed values: in this case, at somewhere around 1.7m2 (a medium –sized adult). Moving away from that intersection, for BSA values lower than 1.7, it is increasingly likely that a measured RV volume will be interpreted as “below the cutoff value", yet exceed a z-score of +4.
For BSA values above approximately 1.7m2, the reverse is true: it is increasingly likely that a measured RV volume will exceed the indexed cutoff value, yet fall below a z-score of +4.

Equivalent Z-Score for 170ml/m2 vs. BSA


This chart shows the equivalent z-score (Buechel et al.) for the conventional cutoff values of 170ml/m2 over the entire range of BSA.

The problem of using an inappropriately indexed value isn’t purely theoretical, and it isn’t just a matter of making it harder for echo researchers to find statistical significance—it is a matter of finding or, frankly, missing patients with important, real, abnormalities.


Wednesday, December 21, 2011

CMR LVEDV Z-Score Mini-Smackdown

examining CMR references for LVEDV reveals interesting differences; doubt is cast upon the practice of generating z-scores for indexed values

I have been tinkering with z-scores for cardiac MRI and I thought it might be interesting to compare a couple of references for LV end-diastolic volume (I always think this stuff is interesting):

So, what I did was create some tables (using the mean and ± 2SD limits), generated some charts, and then made a series of z-score calculations over a range of LVEDV values for two hypothetical patients (view the spreadsheet and calculations for this data HERE).

Data:

First, the Alfakih data: based on their published values for “younger men” using SSFP, the LVEDVi is 87.6 ± 15.6.

LVEDV Reference Values: Alfakih et al.
BSA (m2) ULN (ml) Mean (ml) LLN (ml)
0.5 59 44 29
0.6 71 53 34
0.7 83 61 40
0.8 95 70 46
0.9 106 79 51
1.0 118 88 57
1.1 130 96 63
1.2 142 105 68
1.3 154 114 74
1.4 166 123 80
1.5 177 131 86
1.6 189 140 91
1.7 201 149 97
1.8 213 158 103
1.9 225 166 108
2.0 236 175 114

And then the Buechel data: based on their allometric equation, a * BSAb, and their published values for boys: a = 77.5, b = 1.38, and using the z-score form of

A mathematical equation, expression, or formula.
 Object name is 1532-429X-11-19-i1.gif

... and their published value for the “SD” = 0.0426

LVEDV Reference Values: Buechel et al.
BSA (m2) ULN (ml) Mean (ml) LLN (ml)
0.5 36 30 25
0.6 47 38 32
0.7 58 47 39
0.8 69 57 47
0.9 82 67 55
1.0 94 78 64
1.1 108 88 73
1.2 121 100 82
1.3 135 111 92
1.4 150 123 101
1.5 165 136 111
1.6 180 148 121
1.7 196 161 132
1.8 212 174 143
1.9 229 188 155
2.0 245 201 166


Charts:


Z-Scores:


Generated Z-Scores for Patient BSA = 0.7
LVEDV Z: Alfakih Z: Buechel
15 -4.3 -11.7
20 -3.9 -8.8
25 -3.4 -6.5
30 -2.9 -4.7
35 -2.5 -3.1
40 -2 -1.7
45 -1.5 -0.5
50 -1.1 0.6
55 -0.6 1.5
60 -0.1 2.4
65 0.3 3.2
70 0.8 4
75 1.3 4.7
80 1.7 5.3
85 2.2 6
90 2.7 6.5


Generated Z-Scores for Patient BSA = 1.4
LVEDV Z: Alfakih Z: Buechel
50 -3.4 -9.2
60 -2.9 -7.3
70 -2.5 -5.8
80 -2.0 -4.4
90 -1.5 -3.2
100 -1.1 -2.1
110 -0.6 -1.2
120 -0.1 -0.3
130 0.3 0.5
140 0.8 1.3
150 1.3 2.0
160 1.7 2.7
170 2.2 3.3
180 2.7 3.9
190 3.1 4.4
200 3.6 4.9


Summary

Buechel et al. sum it up nicely in their discussion:

cardiac volumes have a non-linear relation to body surface area, and since the exponential values are different for different cardiac parameters, it would not be appropriate to provide normal values simply indexed to BSA

The textbook Echocardiography in Pediatric and Congenital Heart Disease has an excellent and thorough description of the practice of “indexing”. Essentially, the problem boils down to this: for LVEDV, none of the assumptions for the relationship are met:

In order for the per-BSA method of indexing to work, three assumptions must be met. The relationship to BSA must be linear, the intercept of the regression must be zero, and the variance must be constant over the range of BSA.

If you had to choose a reference for LVEDV in children measured with cardiac MRI, I would have to wonder why anyone would not use the data from Buechel et al.— unless they just did not have those calculations handy.

Well, now they do:

cmr.parameterz.com

Saturday, October 29, 2011

BSA Methods and Cardiac Z-Scores

A spreadsheet comparing different BSA calculations on various patients-- and the resulting BSA-adjusted z-scores-- reveals negligible differences.

Can we compare z-scores from various references when the methods for calculating BSA are different? How?

If a given group of z-score equations are BSA adjusted, and a given patient has a different BSA depending on the BSA formula, how do you perform a comparison? Meaning, if equation A uses BSA formula x, and equation B uses BSA formula y, to what extent are differences in the z-scores due to differences in BSA?

Which then spawns these questions:

  • What is a clinically important difference in BSA?
    • a tenth of a meter2?
    • a hundredth?
    • a thousandth?!?
  • How many significant digits are important when comparing z-scores?

I made this spreadsheet in an effort to examine some of these questions.

(the example z-score equation is from Kaiser et al., JCMR 2008.)

Looking over this data, I totally agree with Dallaire and Dahdah, JASE 2011, who noted:

There was virtually no difference when Z-score equations were derived from BSA estimated with different equations, and misclassification was rare.

Sunday, June 26, 2011

Estimating Pulmonary Artery Pressure from Acceleration Time

Calculate PA pressure using pulmonary artery Doppler acceleration time.


Methods

Doppler interrogation of the pulmonary artery was performed in the parasternal short axis view, with the pulsed-wave sample volume placed at the annulus of the pulmonary valve. The acceleration time was defined as the interval between the onset of systolic pulmonary arterial flow and peak flow velocity.


Pulmonary Artery Acceleration Time Provides an Accurate Estimate of Systolic Pulmonary Arterial Pressure during Transthoracic Echocardiography.
Yared K, Noseworthy P, Weyman AE, McCabe E, Picard MH, Baggish AL.
J Am Soc Echocardiogr. 2011 Jun;24(6):687-92.