Monday, December 27, 2010

Calculating Aortic Regurgitant Fraction

Using the echocardiographically obtained parameters of vena contracta width and abdominal aorta flow VTI’s to estimate the severity of aortic insufficiency.

The recent article An echocardiographic model predicting severity of aortic regurgitation in congenital heart disease presents an interesting model for predicting aortic regurgitation severity. Using MRI as their gold standard, the authors devised a “2 variable” model:

  1. parasternal vena contracta area / BSA
  2. abdominal aorta retrograde flow VTI / antegrade flow VTI

The mathematics-statisitics-voodoo behind developing this model are way beyond me. However, the final model is not too convoluted and it seemed an interesting object for a JavaScript calculator:

AR Fraction Calculator

Monday, May 3, 2010

Prototyping A Simple Database for Pediatric Echo Normal Values

A mashup of Google technologies to create a free, simple, open-access database.

The upcoming ASE Guidelines ”Recommendations for Quantification Methods During the Performance of a Pediatric Echocardiogram”, is intended to serve as The Standard for measurement techniques in pediatric echo. Getting everyone on the same page as far as making measurements is a prerequisite for moving forward with standardizing z-scores for pediatric echocardiography. Anticipating the guidelines, I built a mashup that could serve as a skeleton for a common database of normal values:

Normal Values Database Prototype: The Aortic Root

The above link is to a “working demo”. Feel free to enter any kind of data (fake or otherwise) in order to see it in action. Should I decide to do this “for real” there would likely be some preconditions for using the data form(s) but for now, feel free to use it with abandon.  Of course, I’d love to know what you think.

Wednesday, April 21, 2010

Kawasaki Disease Aneurysm Z-Scores: Another Smackdown

Boston Children’s versus Children’s National Medical Center for a “giant” knockout

When the Children’s National (CNMC) coronary artery z-score equations were published in 2008, I briefly compared them to the 2007 Boston data and noted their similarities. In my opinion, the manner in which the CNMC equations handle the “standard deviation” makes these incompatible with some newly proposed cutoffs. Let me explain.

Classifying Aneurysms

The current AHA criteria for classifying coronary artery aneurysms relies on a combination of z-scores and absolute diameters:

  • any segment with a z-score of > 2.5 = abnormal
  • <5 mm = small
  • 5 – 8 mm = large
  • ≥8 mm = giant

A recent article by Manlhoit et al. points out the folly of using absolute measurements in this instance. They then take the logical next step by introducing a classification system based on z-scores. Using their previously published data (from Boston, see above), the authors advocate the following coronary artery aneurysm z-score classification:

  • ≥2.5 – <5 = small
  • ≥5 – <10 = large
  • ≥10 =  giant

The clinical science behind establishing these cutoff points is presented in the article and is beyond the scope of what I am trying to do here. However, it is worth noting that (at least to me) the proposed system has a certain elegance and symmetry— it just seems reasonable.

Z-Score Equations

The Boston and CNMC equations each predict very similar values for the BSA adjusted mean diameter by using an allometric model. The two equations also yield similar results out to about z-scores of +2. But the similarities end where coronary artery abnormalities begin. Using the new criteria proposed for giant aneurysms ( z ≥10 ) and applying the CNMC equations, patients who previously had giant aneurysms ( ≥8 mm) now only have large aneurysms.
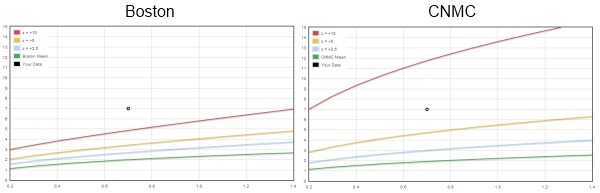
Boston vs. CNMC coronary artery z-score comparison

(See this page for the interactive comparison)

The big difference between the two z-score equations (z = [score – mean] / standard deviation ) is in how they deal with the standard deviation. The Boston equations use a separate regression (on BSA) to predict the SD, while the CNMC equations use the regression mean square error (MSE) statistic as a substitute for the SD.

Residuals

I have always been bothered by the patent substitution of the regression MSE (usually, the square root of the MSE i.e., the RMSE) for the population SD— particularly for the purpose of calculating z-scores. While the “transform both sides” strategy is perfectly legitimate for stabilizing the variance (and indeed, for discovering the allometric relationship!), if you play around with the regression residuals and then back-transform (i.e., exponentiate) your calculations — you have just modeled positive skew.

Detecting skew shouldn’t be all that hard to do. If the values are distributed normally, then it stands to reason that the residuals (observed - predicted) are also normally distributed. A simple plot of the residuals should show us what is going on. Here is the frequency vs. residuals plot from the recent fetal echo reference values of Lee et al.:

freq_v_resid-Lee 

(Similar residuals plots are provided by the crazy-cool online curve fitting at ZunZun.com.)

That’s not to say that skew doesn’t exist. Indeed, that is part of the point and elegance of the recently applied LMS method. It is imperative that we do something to examine the presence or absence of skew, and then describe how we intended to deal with it. Unfortunately, both of these investigations fail to mention this fundamental data characteristic in their respective manuscripts.

Bottom Line

Due to unexplored assumptions about the nature of the residuals/skew of the data, z-score cutoff values are not universal and are absolutely dependent upon their underlying reference z-score equations.

Saturday, March 27, 2010

Aortic Root Z-Scores part deux

sacrebleu!

A new z-score calculator for the aortic root (annulus, sinuses of valsalva, sinotubular junction, ascending aorta) is now available at ParameterZ.com.

In addition to the online z-score calculator I have also created:

Caveats

A couple of things worth mentioning as far as methodology:

  1. Measurement of the sinuses/st jct., AAO are in diastole
  2. Measurements are taken from leading edge - leading edge

The authors claim that these are in accordance with The Guidelines, yet they seem like a break in convention to me.

Sunday, March 14, 2010

Adjusting for size

A recent article includes a cameo appearance by none other than ParameterZ.com:

Method 5: z-scores of LVM indexed for height2.7 were calculated as described in a recent publication which is accessed using an online calculator at http://parameterz.blogspot.com/2008/09/lv-mass-z-scores.html (accessed 6 April 2009).

Incidence of left ventricular hypertrophy in children with kidney disease: impact of method of indexation of left ventricular mass.
Simpson JM, Savis A, Rawlins D, Qureshi S, Sinha MD.
Eur J Echocardiogr. 2009 Dec 15.
 

Unfortunately, the citation is not quite correct. The attribution is for “z-scores of LVM indexed for height2.7" and, well, they are not. The z-scores are LV mass for height, to be sure, but not indexed for height. The authors assure me this was an error on their part and are going to issue a correction. The conclusions of their study remain unaffected by the mis-wording:  different methods of indexation have a profound influence on the categorization of children with respect to LVH.

The term “indexed” in this sense is fraught with misconception. If a measurement is found to be related to body size and an adjustment for body size is attempted- in any form- some are likely to simplify the adjustment by describing the relationship as being indexed to [insert body size parameter here]. Other interpretations are (correctly) more literal, taking the term indexed to mean divided by [insert body size parameter here].  (Further adding to the confusion is the use of the term index in programming jargon to mean “position within an array”, the use of which I am certainly guilty of in the course of explaining how the calculators work).

Adding to this particular variety of confusion is the recent work of one of the co-authors of the Foster et al., work wherein they reverse their previous position and go ahead and officially index LVM/height2.7 but further correct for age (which in its own way seems to correct for height i.e., very few babies are tall). Even more frustration is going to get heaped on the “don’t index stuff” camp by this upcoming JASE article: Predicting Heart Failure Hospitalization and Mortality by Quantitative Echocardiography: Is Body Surface Area the Indexing Method of Choice? The Heart and Soul Study.

I don’t intend to settle this debate. All I am doing with ParameterZ.com is trying to make the information accessible and building some programming skillz in the process. All I can say is read the disclaimer and take it to heart— I do.

All calculations must be confirmed before clinical use or diagnostic purposes by qualified medical professionals.