Thursday, October 3, 2013

Coarctation Prediction in Neonates With PDA

Introducing a JavaScript interpretation of the recently published "coarctation prediction model" from Vanderbilt University Medical Center.

I particularly enjoy little challenges such as this one, issued by the authors of a recent JASE article:


... can be easily integrated into daily work flow by entering the CPM equation into a digital picture archiving and communication system.

(Actually, I find it much easier to put things like this on the web, rather than in our PACS—time for which is often dubbed “non-productive” by administrators. Sigh.)

The article is:

A Clinical Prediction Model to Estimate the Risk for Coarctation of the Aorta in the Presence of a Patent Ductus Arteriosus
Soslow JH, Kavanaugh-McHugh A, Wang L, Saurers DL, Kaushik N, Killen SA, Parra DA.
J Am Soc Echocardiogr. 2013 Sep 23. pii: S0894-7317(13)00658-5

The authors developed a model (a “logistic regression model”) to estimate the probability of developing a coarctation of the aorta, in neonates with a patent ductus arteriosus. If you were trained as I was, the admonishing rule was always that “you can’t rule out a coarctation in the presence of  a large PDA”. And now, it looks like maybe we can.

Using 5 simple linear measurements obtained (easily?) from the suprasternal notch view, several ratios are calculated and plugged into their formula. The resulting calculation is the likelihood (probability) of developing a coarctation. According to the authors, patients below the cutoff of 15%, “no longer require observation” and for patients above the 60% cutoff, we should “continue inpatient observation”.

I find it interesting that a model such as this performs as well as it does without using a z-score. Maybe that’s because z-scores are really only good for telling us if a particular measurement is normal— and not so good at telling how abnormal the measure is. Or, maybe it is because the existing z-scores are not particularly well suited for neonates. Or, maybe still, it’s because the arch anatomy changes dramatically when the ductus closes such that previously normal measurements become abnormal.

Perhaps it is a little of all of the above.

Anyhow, the inputs and calculations are fairly straightforward and easily adapted to a web calculator:

http://parameterz.github.io/vanderbilt-cpm

I thought this was worthy of it’s own project and so, it is now on GitHub (which is another little experiment). The live page is served directly from version control.
Bam.

I like it like that.

Thursday, April 4, 2013

Lean body mass as a scaling variable in pediatric cardiology

lean body mass prediction equations based on height, weight, age, and gender are now available, providing insights into the practice of scaling of cardiovascular parameters to body size.
Recent critical reviews of reference values for pediatric cardiology are frankly sobering: we don’t have many studies with sufficient numbers of patients to draw reasonable conclusions, and the statistical methods are, at times, specious. I considered writing my own critical review of these critical reviews, but that just felt, well, a bit too meta. Please read this critical review of the many methodological limitations,  and this critical review of the statistical methods used in developing the current reference values. These are harsh but honest assessments of the current state of the art. Considering the criticism leveled against the community, it’s enough to make one wonder if anyone out there is even trying to generate worthwhile reference data.
Clearly, some folks are.
Canadians, mostly, by the looks of things.

background

Since the very first time a pediatric cardiologist realized that babies weren’t just tiny adults, and that their hearts are small but proportional to their bodies, we have been in a struggle to figure out how best to adjust for body size. The usual suspects have all been tried, with varying success: age, height, weight, body surface area, various allometric exponents of the same... Some groups advocate that weight alone is the best scaling variable; others argue convincingly that height is better; other groups go back-and-forth between the two (see the works from Mass General: 2009 and 1992 ).
Combining both height and weight, BSA has proven to be quite good as a scaling variable, with a defensible theoretic and empiric case for it’s use (see Sluysman and Colan, JAP 2005). But why should cardiac size scale with height, or weight, or BSA? What is the underlying physical principle that says heart size should be proportional to height? Could it be because tall people breathe thinner atmosphere? Because heavy people have to deal with more friction?
Lean body mass (or “Fat Free Mass”-- our brain, bones, and primarily, muscles) are what demand oxygen. If we were insects, we would just get our oxygen by moving the air right through our little exoskeletons. But most of us are not insects, and we get our oxygen instead via red blood cells, transported through our vast network of tubes, pumped from the heart. The heart has developed to pump oxygenated blood to the tissues that need it.
Thank you very much, Captain Obvious” you say.
But there it is: the heart scales with lean body mass.
Yet, we don’t measure lean body mass. Nobody in the echo lab measures LBM. In fact, it’s a rare person in the echo lab that even knows how to measure it.
Traditionally, measurement of LBM required specialized equipment and training. Personally, I have never seen a pair of skinfold calipers in the cardiology department, and a dunk tank is almost entirely out of the question. I keep thinking a bioelectric impedance tool would somehow magically grow into this role, but I have yet to see that happen. Technically, I think you could measure it in the MRI scanner, but DEXA is probably the gold standard, and I am pretty sure we don’t have one of those machines on campus.
Height and weight (and BSA) may be poor surrogates for LBM, but at least they are easy to measure.

recent work

In the May-June issue of Annals of Human Biology, Foster et al. tackle the idea of developing a series of equations that could predict lean body mass from easily measured anthropometric measures. They measured lean body mass on over 800 children (using DEXA) and then performed some statistical kung-fu to develop their equations... and then validated those equations on another 300 or so patients. Using their prediction equations will get you within 5% of measured lean body mass, a feat that is about on par with some other available measurements (?bioelectric impedance??)
LBM estimated using this simple and inexpensive method may be useful in a variety of settings including ... characterization of the appropriateness of physiologic parameters that scale well to LBM such as resting energy expenditure, heart size, kidney function and drug dosing.
In an article in the current issue of JASE, the same group now apply these new lean body mass prediction equations to the age-old question of how best to determine left ventricular hypertrophy, a matter which they had previously covered and if I might add, raised the bar once already. They go on to demonstrate that— compared to values adjusted for lean body mass— height-adjusted LVM frequently over-estimates the incidence of LVH, and conversely, that BSA-adjusted values frequently under-estimate LVH (though less so than with height) They conclude the present investigation:
LBM is likely the best scaling variable and may be estimated reasonably accurately in children aged 5 to 21 years.
Only by scaling LV mass to LBM will we be able to determine the impact of obesity on heart size.

future directions

I think the ability to estimate LBM is going to be important to the field of reference values for echocardiography. It is, in effect, the holy grail of scaling variables for pediatric cardiology, and cardiology in general.
I believe that this is going to be so important to future research, I want to help you calculate lean body mass on your own data:

http://dev.parameterz.com/lbm/

In an effort to be completely transparent about the calculations, I have also provided a step-by-step worked example lean body mass calculation:

http://dev.parameterz.com/lbm/walkthrough/

And finally, a way to batch-process your data, adding lean body mass by the droves (upload your own csv data)

http://dev.parameterz.com/lbm/upload/

Monday, April 1, 2013

Pretty Useless Surface Charts

a quick update about newly available aortic root reference values.

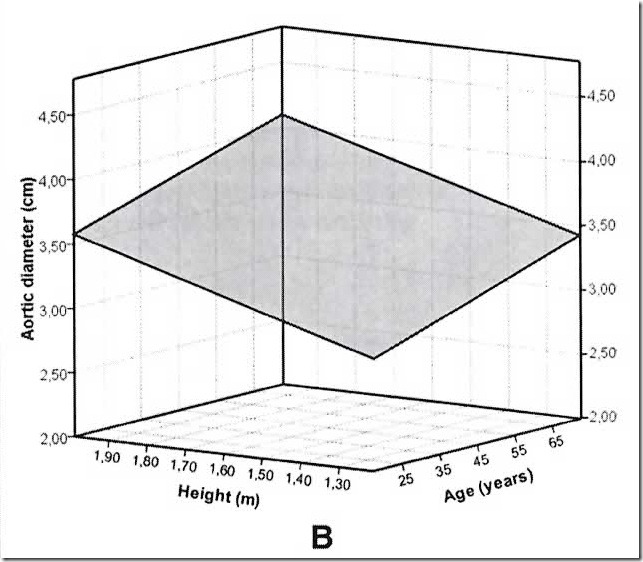
I read the fairly recent AJC article Normal limits in relation to age, body size and gender of two-dimensional echocardiographic aortic root dimensions in persons ≥15 years of age and struggled to make use of their “surface charts”- maybe you did too. Here is an example “surface” representing “aortic diameters” (I presume they mean the sinus of Valsalva) for females:

devereux_nomogram

At first, I thought it was intended to serve as a nomogram, i.e., that this device is what we are supposed to use to check our measured values against... but clearly that is impossible.

Mostly, this is just a simple demonstration of how the authors are communicating to us that aortic diameters increase with both body size and age. You should definitely not try to interpolate reference values from this- you’ll go cross-eyed, almost for sure.

I double-dog dare you to come up with a value for someone in the middle of those axes- say a 45 year old, 160 cm person.

Instead, try this:

aoroot.parameterz.com/devereux2012/

I put together a quick tool that will help you find the correct reference values for the aortic root (aortic valve and sinus of Valsalva) that are gender-specific age- and size-adjusted. For instance, here are the calculated values for the previously mentioned and difficult-to-interpolate 160 cm, 45 year old female:

I did not incorporate these new calculations into the existing ones for a couple of reasons, not the least of which is time. The other concerns are that these new values are mainly for adults (all subjects were >=15yrs), and that these calculations are multi-factorial (age, size, and gender) and would have required a major re-work of the interface, for which I do not have the time. I hope to do some rough comparisons sometime in the future, but for now I hope they are useful for those that deal with adult patients, both young and old.

Tuesday, February 5, 2013

On the Cusp?

upcoming studies addressing the inadequacies of existing reference values for (adult) echocardiography

NORRE Study

...due to the lack of consistency in current echocardiographic ‘reference values’, their use for clinical decision-making remains questionable.

So reads the ‘background’ section of the upcoming NORRE study (NOrmal Reference Ranges for Echocardiography), enrolling subjects aged 25 – 75yrs in 22 labs (mostly in Europe).

EchoNoRMAL Study

The effectiveness of any diagnostic test is dependent upon the test’s ability to accurately detect abnormalities. An assumption of reliability and validity underlies all medical tests and echocardiography is no exception. The definition of ‘abnormal’ relies on the definition of ‘normal’ and needs to acknowledge normal physiological variation that may arise from factors such as body size, gender, and ethnicity.

So reads the introduction of the EchoNoRMAL study, an effort by ambitious scientists in New Zealand. Also concerning adults, aged 18 and up.


Looks like the adult echo community is winning.

Friday, January 18, 2013

The Why and How of... What the?

Print is dead.

When the editorial process of a peer-reviewed journal deteriorates as it does in the January JASE issue, then I think it is safe to say print is dead.

What was destined to be The editorial concerning z-scores for echocardiography will now only make sense if we read the coming errata, which diffuses the point entirely. I considered writing a letter to the editor, but it is not obvious to me that they would bother to read the submitted material or, are at all familiar with the subject.

Not sure what I am driving at? Read the editorial yourself and see if you can make sense of how-- all of a sudden-- we are now supposed to be adjusting cardiac size for body mass index 
(Hint: we’re not. It’s a colossal misprint).

Thursday, December 13, 2012

Scaling in Echocardiography: Psychosis

A recent editorial states “In terms of practicality, developing normative values of right-heart dimensions by indexing to BSA is an important first step and should be encouraged.” If by “encouraged” they mean “discouraged and abandoned” then I totally agree.

An editorial in the December JASE discusses recent additions to the body of knowledge concerning reference values for the right ventricle:

Editorial:

Recent articles:

That reference values for the right ventricle need to be improved is undisputed. However, I think the editorial went awry and gave some of the authors an undeserved pass.

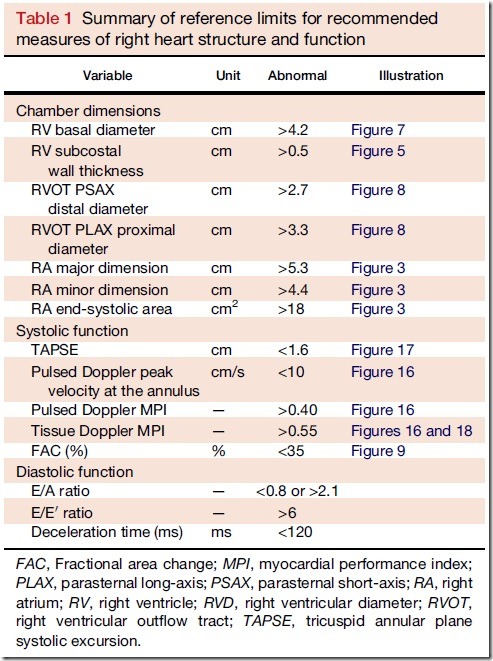
Firstly, as a matter of clarification, I believe the current guidelines for the right ventricle are unsuitable. Here’s why: they provide unscaled values:

ASE_right_heart_ref_vals

In fact, the terms “scaled” and “body size” do not appear in the guideline document.
Anywhere.

Secondly, the editorial nicely details many of the shortcomings of indexing (i.e., heart size ÷ body size):

This approach is problematic for three reasons. First, the correlation between the cardiovascular parameter and body size may not be linear and may have unanticipated variation; second, difficulties may result when scaling a cardiovascular parameter to a body size parameter that has different dimensions (e.g., volume vs. area); and finally, it has been shown that ratiometric scaling does not produce size-independent scaled cardiovascular variables (i.e., the ratiometrically scaled variable (still) correlates with body size).

Yet the final assessment of the editorial is that indexed values are a “practical compromise”:

Indexing to BSA is a practical compromise but is inaccurate insofar as body composition affects the relation between body mass or surface area and cardiovascular variables; this problem may be particularly troublesome when normalizing dimensions in obese populations... In terms of practicality, developing normative values of right-heart dimensions by indexing to BSA is an important first step and should be encouraged.

There is some real truth in the problematic matter of using BSA as the size-adjusting parameter. The cardiovascular system has been optimized to deliver oxygen to tissues with a high metabolic need for it, i.e., lean body mass. Body surface area is a poor surrogate for LBM and, therefore, poorly represents the true relationship between body size, cardiac output, and organ size. But that is a problem for every attempt to scale heart size to body size, and not a unique problem for indexing. Indexing has it’s own flaws—fatal flaws—and couching those flaws in the terms of “BSA may be inadequate for obese populations” is misleading.

To be fair, the article by D’Andrea et al. understands the perils of indexing, and they should be recognized for their approach:

On the basis of the theoretical and empirical limitations of ratio scaling, we checked whether this scaling approach removed the influence of body size using a simple bivariate correlation approach. Where ratio scaling failed to remove the influence of body size, we subsequently investigated the nature of the allometric relationships between the BSA and 3D RV volumes and determined whether allometric scaling for the BSA provided size-independent RV dimensional indexes. Allometric scaling of the general form y = a * xb was used.


In my opinion, the most rational piece of work covering the matter is the fantastic editorial, Does size matter? Clinical applications of scaling cardiac size and function for body size. It is so relevant to the topic, it was cited in the current editorial 4 times. However, those authors arrived at the entire opposite conclusion:

indiscriminate use of ratiometric scaling approaches is at best problematic and at worst dangerous...

Reliance on parameters ratiometrically scaled to BSA for clinical decision making should be discouraged.

What we need in echocardiography is something of a reality check...

Stay tuned for that:
A Review and Critique of the Statistical Methods Used to Generate Reference Values in Pediatric Echocardiography.

Saturday, November 24, 2012

LVEDV Z-Scores

The second of two recent updates to app.parameterz.com is the addition of the left ventricular volume and dimension data supplied by this recent article:

Normalized end-systolic volume and pre-load reserve predict ventricular dysfunction following surgery for aortic regurgitation independent of body size.
Gentles TL, French JK, Zeng I, Milsom PF, Finucane AK, Wilson NJ.
JACC Cardiovasc Imaging. 2012 Jun;5(6):626-33.
(The equations are provided via an online supplement, supplied to me by the authors.)
Although the article describes equations for LV function and dimensions, I use only the dimensional z-scores. The form of these equations is that of an allometric relationship with BSA, with log-log transformation of both the measured value and the BSA.
The formula used for estimating BSA is not described within the article/supplement; I am awaiting a response from the authors on this. In the meantime, calculations are made using the Haycock formula.

LVEDD and LVESD

The allometric equations for the LVEDD and LVESD use exponents of around 0.4, which is slightly less than what would be expected by the theory of geometric similarity: 0.5. Numerous other authors have discovered linear relationships when correcting/adjusting linear dimensions (cm) to body surface area (m2). Additionally, the LVESD values seem a bit off when compared to other available sources:
image
(I have contacted the authors; awaiting their response)

LVEDV and LVESV

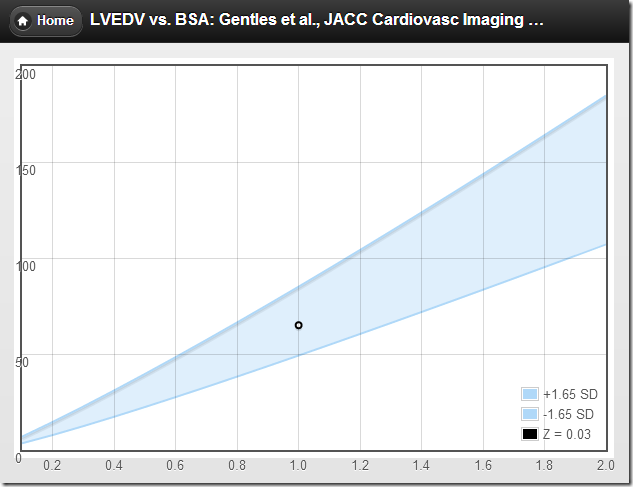
Data for the left ventricular volumes is also in the form of an allometric relationship with BSA, with an exponent of around 1.1. Again, this differs somewhat from what would be predicted by geometric similarity, and by other empirical evidence. The closer the exponent is to 1.0, the more the relationship is strictly linear with BSA, which is unexpected, particularly since the authors recognize this peril:
However, the relationship between body size and LV size is nonlinear
Yet, when you plot out the predicted values, it looks quite linear:
image
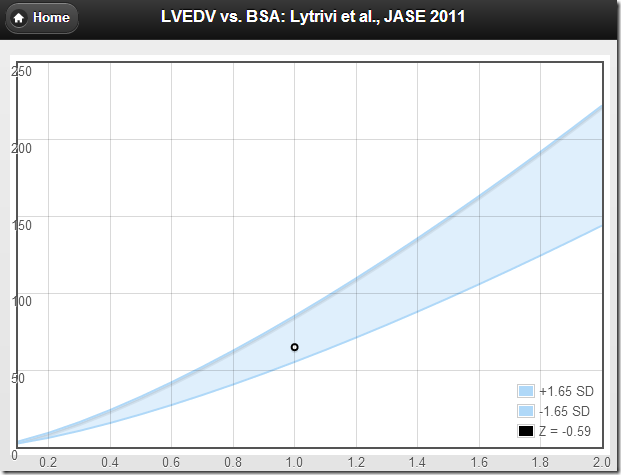
versus an allometric equation with an exponent of 1.38 (Lytrivi et al.):
image
Anyhow, given the paucity of ventricular volume z-score equations, these are now included among other pediatric echo z-score calculations at

app.parameterz.com


***update Dec 2012***
The author has advised me that there was an error with the online supplement.
"The intercept for ESD should be 2.56 NOT 3.56 as is on the web"
The app now uses the updated value.

Friday, November 23, 2012

Left Atrial Volume Z-Scores

Calculating BSA-adjusted z-scores of LA volume using an allometric equation
The first of two new calculations added to app.parameterz.com is based this recent article:

Normal values of left atrial volume in pediatric age group using a validated allometric model.
Bhatla P, Nielsen JC, Ko HH, Doucette J, Lytrivi ID, Srivastava S.
Circ Cardiovasc Imaging. 2012 Nov 1;5(6):791-6.

Similar to how this same group calculates z-scores for LV end-diastolic volume, they found an allometric equation that scales well with body size (in this case, two equations) and they index to that. For left atrial volume, there is one equation for BSA ≤ 1.0 and another equation for BSA > 1.0. The allometric exponent for the bigger kids, i.e., BSA1.08, is not much different than just indexing to BSA, which strikes me as interesting.
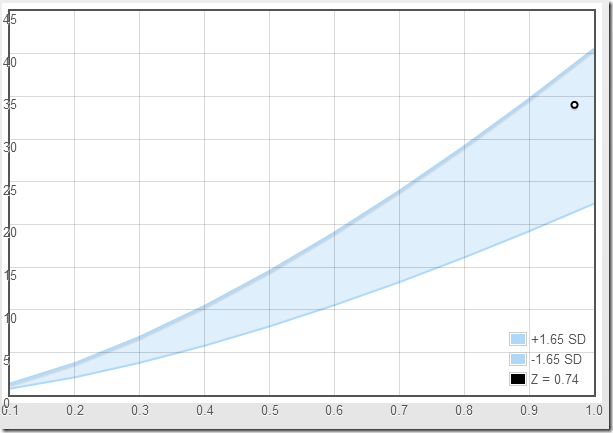
I think the stratification into two groups would be more palatable if the interface was seamless, but in this case it is not. Let’s have a look at two patients with an LA volume of 34ml, one just under 1.0 meters squared and the other, just above.
  1. BSA = 0.97; z = 0.74
  2. BSA = 1.03; z = 1.65
And their accompanying plots:

BSA = 0.96

image

BSA = 1.03

image
For the smaller patient, the LA volume of 34 ml is well within the normal range, but for the slightly larger patient, the same LA volume is now at the upper limit of normal. Weird, huh?
Plus, it gets a little more interesting. If we assume that 125-131 cm is about the appropriate height for a 7 year old, and we plug the same data into another calculation, the indexed left atrial volume is definitely large, with a z-score of 3.5:
image
Anyhow (as always) I don’t pretend to have the answers— I just pose questions. Feel free to play around with this and other z-score calculations at:

app.parameterz.com

Friday, March 23, 2012

Fetal Tissue Doppler Z-Scores

Reference values and z-score calculations for fetal tissue Doppler E, A, and S waves added to new fetal echo z-score app.

I just wrapped up the design and implementation of a new fetal echo z-score site (fetal.parameterz.com) and as a test of the new modular design, I added the fetal tissue Doppler data from this recent article:

Gestational age- and estimated fetal weight-adjusted reference ranges for myocardial tissue Doppler indices at 24-41 weeks' gestation.
Comas M, Crispi F, Gómez O, Puerto B, Figueras F, Gratacós E.
Ultrasound Obstet Gynecol. 2011 Jan;37(1):57-64.

Although the article provides equations that adjust for fetal weight, since no pediatric cardiologist has ever asked me to estimate the fetal weight *wipes brow*, I have only included the gestational age-adjusted equations.

Jumping ahead for just a second, here is an example of the results page:

screenshot of fetal z-score app: results

fetal tissue Doppler z-scores for a 28wk4d fetus

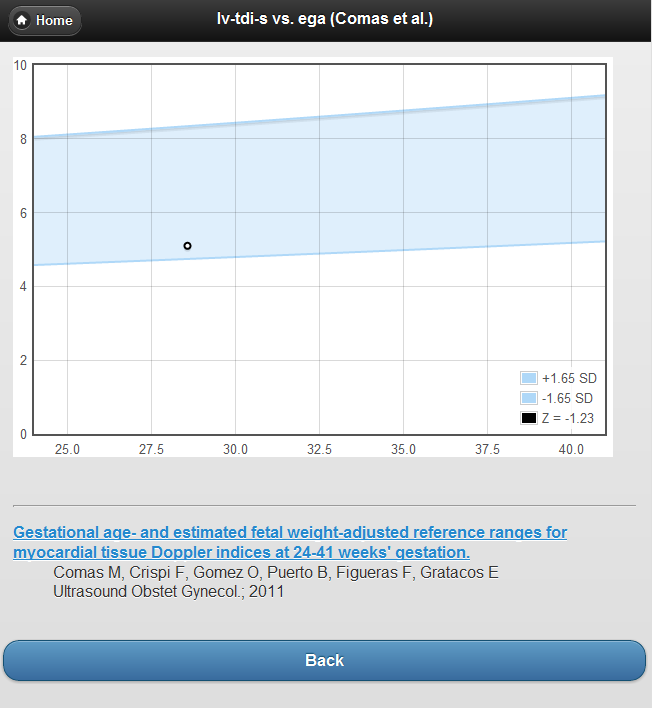
and here is an example chart:

screenshot of fetal z-score app: TDI plot

fetal tissue Doppler LV TDI S vs. EGA

Challenges

Implementing a class that provided a common interface for calculating a mean, range, and z-score was non-trivial for this reference. There are no fewer than 5 distinct models that govern the E’, A’, and S’ calculations:

  1. linear model with constant variance
  2. linear model with non-constant variance
  3. log-linear model with constant variance (log-normal)
  4. log-linear model with non-constant variance (NOT log-normal ?)
  5. log-polynomial model with non-constant variance (NOT log-normal?)

A second challenge was getting my calculations (based on the published data) to reconcile with the supplemental material (an Excel spreadsheet). In a few instances the spreadsheet used data with more significant digits than in the article, and in a few other instances the spreadsheet incorrectly exponentiates the “standard deviation” term. In the end, I figured that I had to go with the published data over the supplemental data. Also, it became clear after referring to the charts that the spreadsheet data was incorrect.

Concerns

Apart from the multiple models and the occasional inconsistency in the formulae, there is also the small matter of the article failing to provide the typical correlation coefficients for the models, and, therefore, necessarily omitting the “R-squared” values. The R2 tell us about the goodness-of-fit or, sometimes, how much of the variance is explained by the model. For some of the dependent variables this seemed like an important omission as the models appear promising. I have included the data for the E’, A’, and S’ because they do look somewhat promising. I did not include the data for the derived values like the E’/A’,  E/E’ ratios or the MPI calculations because, to me, they seem dodgy—particularly without an R2.

Summary

  1. New fetal echo z-score calculator
  2. New calculations for fetal tissue Doppler
  3. I welcome your comments and criticisms

Sunday, March 4, 2012

The Problem with Indexing Volumes to BSA

Wherein the inappropriate indexation of cardiac volumes to BSA is explored, this time with charts!


For some time now I have been aware of and abiding by the following words of caution:
linear dimensions and volumes have a nonlinear relation to surface area and
are more appropriately indexed by surface area to the 0.5 and 1.5 power, respectively.

-- Gutgesell and Rembold, Am J Cardiol. 1990
But since I work mostly with echocardiography and echocardiography has, mostly, gotten this message I haven’t explored the problem much. Recently though, I have been reading some of the cardiac MRI literature. Plus, it’s hard not to see some reference to CMR even in the echo literature. A lot of the CMR literature seem to use a cutoff for ventricular chamber enlargement like:
170 ml/m2
And, in the search for improving the sensitivity of echo, many study designs pit echo measures against CMR measures.
So what is the problem?
What are the consequences of an inappropriate index?

I put together a few charts that helped me to understand the real hazards of what sounds like a mostly theoretical problem—maybe they will be useful to others as well:

RVEDV vs. BSA


This chart shows the expected nonlinear relationship between RVEDV and BSA: the predicted values (grey) and the somewhat arbitrary z-score upper limit of +4 (red) are those of Buechel et al.; the conventional cutoff values of 170ml/m2 are in yellow. Note that only at one place along the BSA spectrum is there an overlap of z-score and conventional indexed values: in this case, at somewhere around 1.7m2 (a medium –sized adult). Moving away from that intersection, for BSA values lower than 1.7, it is increasingly likely that a measured RV volume will be interpreted as “below the cutoff value", yet exceed a z-score of +4.
For BSA values above approximately 1.7m2, the reverse is true: it is increasingly likely that a measured RV volume will exceed the indexed cutoff value, yet fall below a z-score of +4.

Equivalent Z-Score for 170ml/m2 vs. BSA


This chart shows the equivalent z-score (Buechel et al.) for the conventional cutoff values of 170ml/m2 over the entire range of BSA.

The problem of using an inappropriately indexed value isn’t purely theoretical, and it isn’t just a matter of making it harder for echo researchers to find statistical significance—it is a matter of finding or, frankly, missing patients with important, real, abnormalities.


Wednesday, December 21, 2011

CMR LVEDV Z-Score Mini-Smackdown

examining CMR references for LVEDV reveals interesting differences; doubt is cast upon the practice of generating z-scores for indexed values

I have been tinkering with z-scores for cardiac MRI and I thought it might be interesting to compare a couple of references for LV end-diastolic volume (I always think this stuff is interesting):

So, what I did was create some tables (using the mean and ± 2SD limits), generated some charts, and then made a series of z-score calculations over a range of LVEDV values for two hypothetical patients (view the spreadsheet and calculations for this data HERE).

Data:

First, the Alfakih data: based on their published values for “younger men” using SSFP, the LVEDVi is 87.6 ± 15.6.

LVEDV Reference Values: Alfakih et al.
BSA (m2) ULN (ml) Mean (ml) LLN (ml)
0.5 59 44 29
0.6 71 53 34
0.7 83 61 40
0.8 95 70 46
0.9 106 79 51
1.0 118 88 57
1.1 130 96 63
1.2 142 105 68
1.3 154 114 74
1.4 166 123 80
1.5 177 131 86
1.6 189 140 91
1.7 201 149 97
1.8 213 158 103
1.9 225 166 108
2.0 236 175 114

And then the Buechel data: based on their allometric equation, a * BSAb, and their published values for boys: a = 77.5, b = 1.38, and using the z-score form of

A mathematical equation, expression, or formula.
 Object name is 1532-429X-11-19-i1.gif

... and their published value for the “SD” = 0.0426

LVEDV Reference Values: Buechel et al.
BSA (m2) ULN (ml) Mean (ml) LLN (ml)
0.5 36 30 25
0.6 47 38 32
0.7 58 47 39
0.8 69 57 47
0.9 82 67 55
1.0 94 78 64
1.1 108 88 73
1.2 121 100 82
1.3 135 111 92
1.4 150 123 101
1.5 165 136 111
1.6 180 148 121
1.7 196 161 132
1.8 212 174 143
1.9 229 188 155
2.0 245 201 166


Charts:


Z-Scores:


Generated Z-Scores for Patient BSA = 0.7
LVEDV Z: Alfakih Z: Buechel
15 -4.3 -11.7
20 -3.9 -8.8
25 -3.4 -6.5
30 -2.9 -4.7
35 -2.5 -3.1
40 -2 -1.7
45 -1.5 -0.5
50 -1.1 0.6
55 -0.6 1.5
60 -0.1 2.4
65 0.3 3.2
70 0.8 4
75 1.3 4.7
80 1.7 5.3
85 2.2 6
90 2.7 6.5


Generated Z-Scores for Patient BSA = 1.4
LVEDV Z: Alfakih Z: Buechel
50 -3.4 -9.2
60 -2.9 -7.3
70 -2.5 -5.8
80 -2.0 -4.4
90 -1.5 -3.2
100 -1.1 -2.1
110 -0.6 -1.2
120 -0.1 -0.3
130 0.3 0.5
140 0.8 1.3
150 1.3 2.0
160 1.7 2.7
170 2.2 3.3
180 2.7 3.9
190 3.1 4.4
200 3.6 4.9


Summary

Buechel et al. sum it up nicely in their discussion:

cardiac volumes have a non-linear relation to body surface area, and since the exponential values are different for different cardiac parameters, it would not be appropriate to provide normal values simply indexed to BSA

The textbook Echocardiography in Pediatric and Congenital Heart Disease has an excellent and thorough description of the practice of “indexing”. Essentially, the problem boils down to this: for LVEDV, none of the assumptions for the relationship are met:

In order for the per-BSA method of indexing to work, three assumptions must be met. The relationship to BSA must be linear, the intercept of the regression must be zero, and the variance must be constant over the range of BSA.

If you had to choose a reference for LVEDV in children measured with cardiac MRI, I would have to wonder why anyone would not use the data from Buechel et al.— unless they just did not have those calculations handy.

Well, now they do:

cmr.parameterz.com

Saturday, October 29, 2011

BSA Methods and Cardiac Z-Scores

A spreadsheet comparing different BSA calculations on various patients-- and the resulting BSA-adjusted z-scores-- reveals negligible differences.

Can we compare z-scores from various references when the methods for calculating BSA are different? How?

If a given group of z-score equations are BSA adjusted, and a given patient has a different BSA depending on the BSA formula, how do you perform a comparison? Meaning, if equation A uses BSA formula x, and equation B uses BSA formula y, to what extent are differences in the z-scores due to differences in BSA?

Which then spawns these questions:

  • What is a clinically important difference in BSA?
    • a tenth of a meter2?
    • a hundredth?
    • a thousandth?!?
  • How many significant digits are important when comparing z-scores?

I made this spreadsheet in an effort to examine some of these questions.

(the example z-score equation is from Kaiser et al., JCMR 2008.)

Looking over this data, I totally agree with Dallaire and Dahdah, JASE 2011, who noted:

There was virtually no difference when Z-score equations were derived from BSA estimated with different equations, and misclassification was rare.

Sunday, June 26, 2011

Estimating Pulmonary Artery Pressure from Acceleration Time

Calculate PA pressure using pulmonary artery Doppler acceleration time.


Methods

Doppler interrogation of the pulmonary artery was performed in the parasternal short axis view, with the pulsed-wave sample volume placed at the annulus of the pulmonary valve. The acceleration time was defined as the interval between the onset of systolic pulmonary arterial flow and peak flow velocity.


Pulmonary Artery Acceleration Time Provides an Accurate Estimate of Systolic Pulmonary Arterial Pressure during Transthoracic Echocardiography.
Yared K, Noseworthy P, Weyman AE, McCabe E, Picard MH, Baggish AL.
J Am Soc Echocardiogr. 2011 Jun;24(6):687-92.

Saturday, March 19, 2011

Aortic Root Reference Values Charts

A little decoration for the aortic root z-score calculator: charts.

Charts add a little ‘sugar’ to the reporting of the aortic root z-scores, by adding an important visual element to the situation.

I have tinkered with charts for the aortic root before, with a few ‘smack-down’ pages, but this is the first large-scale incorporation of the charts with the z-score calculator (well, that’s not exactly true, I do have a cute little chart for the TAPSE z-score calculator. But as far a scale , goes-- this is bigger and better.)

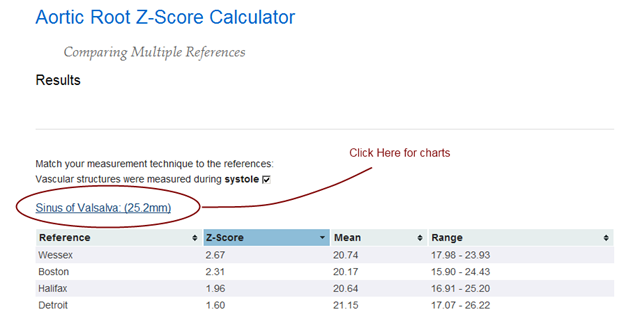
Now, when you see the results page from a z-score calculation, you can click on the sub-heading to link to a page with the appropriate charts for that patient:

aortic_root_charts_link

Clicking on the link illustrated in the above image takes you to these charts:

http://aoroot.parameterz.com/chart?site=sov&bsa=0.99&score=25.2

I took a small bit of design license in building these chart pages: I use the Haycock BSA formula for the patient’s BSA, even though it is not always (rarely?) the default equation used for the individual references. It made the difference between doing it in one sitting (OK, two), and probably not getting it done at all. It was just too complicated the way I had designed the base classes.

Sunday, March 13, 2011

Aortic Root and LV Volume Z-Score Calculators

Two new z-score calculators on Parameterz.com plus a paradigm shift or two

First, the z-score calculators:

  1. LV End-Diastolic Volume z-scores, using the 5/6 A-L method
  2. A consolidated Aortic Root z-score calculator

The paradigm shifts are these:

  1. All calculations are now server-side, using Python
  2. The Aortic Root calculator is a prototype for combining all available references into one calculator/results page


LV EDV Z-Score Calculator

These z-scores are based on the recent work Normal values for left ventricular volume in infants and young children by the echocardiographic subxiphoid five-sixth area by length (bullet) method, from the Feb 2011 JASE. This is a terrific approach to what is traditionally considered a difficult measurement to calculate and normalize. For one, ventricular volumes calculated by the traditional Simpson’s bi-plane technique are notoriously unreliable. To wit, the recent abstract from the PHN citing the 5/6 A-L technique as superioir:


Variability of LV size and function measurements in children with DCM is reduced when utilizing the 5/6 AL algorithm.

(Margossian et al., JASE; May 2010)

The authors cite their own previous work as demonstrating the 5/6 A-L technique to be valid with regards to correlating well with MRI volumes.

On another front, the equations presented in this article also dramatically simplify the very complex relationship of ventricular volume and size, thought to be multi-factorial based on ejection fraction, heart rate, cardiac output, and BSA. A theoretical allometric relationship between EDV and BSA was recently described to be approximately


...the predicted relationship is EDV ≈ BSA1.4

Theoretical and empirical derivation of cardiovascular allometric relationships in children.
Sluysmans T, Colan SD.
J Appl Physiol. 2005 Aug;99(2):445-57

The allometric relationship described in this article is with BSA1.38, which is, well, awesome.

The calculator itself is sort-of a hybrid calculator, in that the BSA and volumes are calculated with JS on the client, then the page is posted to the server and the z-scores are calculated using Python. Another novel aspect to this calculator is that, by virtue of the calculations being performed on the server, I can provide a running tab of recent calculations, resulting in a real-time plot of actual EDV vs. BSA data:

LVEDV vs. BSA

This is not the right calculator to be used for collecting normative data, but what I am learning about server-side programming-- like with this calculator-- is getting me much closer to realizing such a design.

Aortic Root Z-Score Calculator

This calculator is a combination of what I had learned from building the LVEDV calculator and from the prototype design of the multi-referenced coronary artery z-score calculator. The essence of the design is that the patient demographics and measurement data are entered once and the z-scores and reference ranges from each of several references are returned to you in what I hope is an easy  to use, sortable, results table:

http://aoroot.parameterz.com/calc?ht=128&wt=28&aov=15.5&sov=25&stj=18&aao=21

The data required to make the calculations are part of the url (i.e., the “query string”) so the results are essentially permanent and “linkable” should anyone find any need for such a feature.

The references for calculating aortic root z-scores use various BSA equations. This calculator applies the correct BSA formula to each calculation, and thus the z-scores between each reference should be comparable, even though the calculated BSA’s are slightly different. For posterity’s sake, the different BSA calculations are also provided, which therefore makes this a very elaborate BSA calculator:

http://aoroot.parameterz.com/calc?ht=128&wt=28

Also, since not all the references use the same measurement methodology, an allowance is made to show only the appropriate calculations based on your local methodology, i.e., I filter the results based on whether the user indicates the measurement of the vascular aspects of the aortic root were measured in systole or diastole.

To be sure, all of this could have been done on the client with JavaScript, but I thought it was time to grow up.

Thursday, January 20, 2011

Reference Benchmarks

A look at evolving benchmarks for pediatric cardiac reference data

I read with some interest the article Optimal Normative Pediatric Cardiac Structure Dimensions for Clinical Use and was amused to see an off-hand reference to Parameter(z):

Pettersen et al’s paper does not specify which BSA formula was utilized; however, the cardiac dimensions they measured have been normalized using both the DuBois and the Haycock et al formula and are available elsewhere.

I am always curious about the context in which Parameter(z) might appear, and in this case I’d like to add my own two cents.

The authors of the paper set out to review the literature and recommend the “optimal normative data set” for cardiac structures/dimensions-- a familiar, if not worthy, cause. Along the way the authors note several criteria (I am going to call them benchmarks)  for consideration:

  • sample size—larger studies are better
  • normalization factor
    • allometric equation is best
    • Haycock BSA equation is best
  • measurement technique/protocol—those according to current guidelines are best
  • consideration for race and gender
  • “sophisticated” analysis (like the LMS method) are mentioned (preferred?)

Race and gender considerations are mentioned, but it is not clear if these were separate criteria, or if they only had a bearing on which BSA formula to use. To give them the benefit of the doubt, I will leave them in as bonus benchmarks. The authors then go on to recommend the data from Detroit as the “optimal” data set.

While I don’t disagree with any of these benchmarks, I do think some clarification might be useful. An allometric equation is certainly a useful approach for describing the growth of structures-- the biologic relationship between structure and body size-- and I am a big fan of this approach. A “sophisticated” analysis like the LMS method is a completely different approach, independent and ignorant of any underlying biologic process. I am also a big fan of this type of analysis. The message here is that you either do a predictive analysis, preferably using an allometric equation OR you do a descriptive analysis, preferably using the LMS method.

The principle feature of the LMS method is that it accounts for things like skew and heteroscedasticity and results in valid, normally distributed z-scores. There are other ways to achieve this though, as was recently present in the manuscript New equations and a critical appraisal of coronary artery Z scores in healthy children. Here, the authors apply the Anderson-Darling goodness-of-fit test to determine if their data (derived from an allometric equation) depart from a normal distribution.

So, the first point is this—one of the benchmarks should read: equations result in valid, normally distributed data, either by use of the LMS (or similar) method, or by performing some type of analysis confirming a normal distribution.

The second point is this: I don’t think the Detroit data holds up well to these benchmarks and should not be described as “optimal”. Certainly, theirs is a large study (>700 patients), and they indeed followed current guidelines for the measurements. However, on every other point I believe they fail:

  • they do not use an allometric equation (theirs is a polynomial equation)
  • they do not use the preferred BSA equation (via a personal communication, I learned they used DuBois & DuBois)
  • they do not include race or gender in their analysis (in fact, no demographic data is presented—at all)
  • they did not use the LMS method, or perform any distribution analysis

Are they better than nothing? Absolutely
A step in the right direction? Agreed
But optimal?


I will say this about the Detroit z-score calculator though: it is the most popular of all the calculators at Parameter(z). In the past 6 months:

  • 19,165 pageviews; 15.26% of all site traffic
  • average 160 visits per day
  • average 3:56 time on page
  • visited most by users in California, Virginia, Georgia, Chile, and North Carolina

The equations may not be optimal, but—for better or worse—they are getting a lot of use.

Wednesday, January 12, 2011

Q and A with Frédéric and Nagib

The January issue of JASE holds this gem of a manuscript:


New equations and a critical appraisal of coronary artery Z scores in healthy children.
Dallaire F, Dahdah N.
J Am Soc Echocardiogr. 2011 Jan;24(1):60-74. Epub 2010 Nov 13.

The title couldn’t be any more fitting-- it is a must-read for anyone interested in the matter of z-scores for pediatric cardiology.

The authors have graciously agreed to allow me to post their answers to my “follow up  questions”:

Q: Thanks for introducing us to the Anderson-Darling normal distribution test. However, why not include a few frequency vs. residuals histograms for the cavemen in the audience like me? We like pictures...
A: We used such histograms in our analysis to “visually” assess normality. Our article was however long and we had to cut down some of the text and figures. Here’s the frequency distribution for left main coronary artery Z scores (final model with square root of body surface area) DallaireDistribution
Q: Are there other normality tests? Why the Anderson-Darling test?
A: The Anderson-Darling test tests whether a sample fit to a given distribution. When used to test for departure from normality, it is one of the most powerful. SAS also gives the results for the Kolmogorov-Smirnov and Cramer-von Mises tests, which are less sensitive.
Q: The power model described in the article has the form: y = a +b1x2+b2x Why isn't that a polynomial model (quadratic)? I was expecting a model of the form: y : x(see chart).
powers plot
Is this just a matter of semantics, or is the power model misnamed?
A: Yes, we should have named it a polynomial model.
Q: Judging by the spread/skew of the +/- 2SD curves on the “exponential model”, it looks like a log-normal curve... how did you treat the SD with this model?
A: In the exponential model, body surface area and coronary diameter were both log-transformed and then the model was fitted. The SD used was thus the one of a linear model on log-transformed values. Even with the logarithmic transformation, there was residual heteroscedasticity and a weighted least-square model was used. The weight in the model was the inverse of the linear regression of the residuals (on log-transformed values).
Q: Your “exponential model” empirically arrived at an exponent of 0.544-- similar to your theoretical “square root model”: y = a + b1x0.5. However, the Boston and Washington, D.C. models are similar and have exponents of something like 0.3xx. Is the difference between the exponents attributed to your larger sample size, or could there be something else going on here?
A: Hard to say. I would guess that aside from the greater sample size, it is likely the better representation of small children and infants that made the difference. If the theoretical model of optimal cardiovascular allometry proposed by Sluysmans and Colan in 2004 is true, it seems logical that a good representation of children from all ages helped to produce a “real-life” model close to the theoretical model proposed by Sluysmans and Colan.
Q: The final models described in the article are very similar in form to many of the z-score equations from Boston: 2 regression equations; one for the mean, one for the SD. However, the Boston equations predict the SD by a regression against BSA. Your SD equations are run against the square root of the BSA. How does one determine the best model for the variance?
A: The best model for variance should be determined in the same way the model for the mean is. That is, one should ensure that the residuals are free of a trend (no association should exist between the residual and the independent variable). In other words, there should not be an association between the residuals of the residuals and the dependent variable. This was verified for our data but was apparently not done in previous series, including Boston’s.
Q: I keep wondering: if we took a hundred patients with the same BSA, what is the mean/median/mode/min/max/distribution of those measurements? What does that curve look like? Had you considered using something like the “LMS” method to do a group-wise evaluation?
A: The use of a Z score assumes that the coronary diameters of x patients with a given BSA are normally distributed. In fact, our modelisation supposes that for any given value of BSA, there exists a number of subjects that are normally distributed around the mean (see our figure). If so, the median, mode and mean should be the same. The important thing is that in the absence of such a distribution, the Z score cannot be used to estimated percentiles, which is its principal (only?) value. In the lab, one wants to know if a coronary diameters exceeds the 95th or 98th percentile for a given BSA to be able to answer the question “is that coronary abnormal?”. Such percentiles can only be estimated if the data is normally distributed. Q8fig
Q: What do you think explains how the proximal RCA has a normal distribution in your analysis but the distal RCA does not?
A: The distal RCA has two particularities. 1) distal RCA is the most difficult to view and, therefore, to measure. We are confident all distal RCA measurements we use to compute our equations were properly imaged and measured (number of distal RCA samples are the lowest compared to the other segments in our report). The difficulty of obtaining good image might have played a part, but we do not think this is the main reason for the non normal distribution... 2) Essentially, the size of the distal RCA depends on whether or not the RCA is dominant or not (typically 2/3 vs 1/3 of normal humans). We think this is the most probable explanation for not perfectly symmetric variability among subjects. In brief, we believe that the dominance factor is the key answer. One way to verify this hypothesis is to take the adventure of measuring the distal circumflex (posterior rim) and compare with the distal RCA in a series of subjects...
Q: If you consider coronary arteries as a microcosm of the larger reference values issue in pediatric cardiology, what implications does your work have for the existing body of z-score equations?
A: Surprisingly, very little proper validation of reference values and normalisation has been done in paediatric echocardiography. We advocate for a close examination (and potentially a redo when appropriate) of nearly all equations so far available in the literature. Some of them are probably adequate, but in the absence of a good description of the final distribution, it is difficult to affirm with confidence.
Q: Do you have any advice for others, like the ASE, that are going forward with developing new models and z-score equations?
A: Simply fitting a modelled curve in the data is not enough. Since Z scores are dependent on the distribution of the data, one should absolutely test the Z score distribution obtained. One should also ensure that there is no residual trend and no residual heteroscedasticity. We believe that Z scores are a very useful tool for interpreting cardiac structure dimensions in paediatric settings. They must however be based on sound unbiased mathematical grounds.

Naturally, a z-score calculator has been posted up at ParameterZ.com:

http://parameterz.blogspot.com/2010/11/montreal-coronary-artery-z-scores.html

I also made this into it’s own project, making comparisons between the new data and previous coronary artery z-score equations:

http://code.google.com/p/parameterz-coronaries/

-- more on that later.

I thank and congratulate the authors for their outstanding manuscript, and for their patience and generosity by way of indulging me and my questions.

Monday, December 27, 2010

Calculating Aortic Regurgitant Fraction

Using the echocardiographically obtained parameters of vena contracta width and abdominal aorta flow VTI’s to estimate the severity of aortic insufficiency.

The recent article An echocardiographic model predicting severity of aortic regurgitation in congenital heart disease presents an interesting model for predicting aortic regurgitation severity. Using MRI as their gold standard, the authors devised a “2 variable” model:

  1. parasternal vena contracta area / BSA
  2. abdominal aorta retrograde flow VTI / antegrade flow VTI

The mathematics-statisitics-voodoo behind developing this model are way beyond me. However, the final model is not too convoluted and it seemed an interesting object for a JavaScript calculator:

AR Fraction Calculator

Monday, May 3, 2010

Prototyping A Simple Database for Pediatric Echo Normal Values

A mashup of Google technologies to create a free, simple, open-access database.

The upcoming ASE Guidelines ”Recommendations for Quantification Methods During the Performance of a Pediatric Echocardiogram”, is intended to serve as The Standard for measurement techniques in pediatric echo. Getting everyone on the same page as far as making measurements is a prerequisite for moving forward with standardizing z-scores for pediatric echocardiography. Anticipating the guidelines, I built a mashup that could serve as a skeleton for a common database of normal values:

Normal Values Database Prototype: The Aortic Root

The above link is to a “working demo”. Feel free to enter any kind of data (fake or otherwise) in order to see it in action. Should I decide to do this “for real” there would likely be some preconditions for using the data form(s) but for now, feel free to use it with abandon.  Of course, I’d love to know what you think.

Wednesday, April 21, 2010

Kawasaki Disease Aneurysm Z-Scores: Another Smackdown

Boston Children’s versus Children’s National Medical Center for a “giant” knockout

When the Children’s National (CNMC) coronary artery z-score equations were published in 2008, I briefly compared them to the 2007 Boston data and noted their similarities. In my opinion, the manner in which the CNMC equations handle the “standard deviation” makes these incompatible with some newly proposed cutoffs. Let me explain.

Classifying Aneurysms

The current AHA criteria for classifying coronary artery aneurysms relies on a combination of z-scores and absolute diameters:

  • any segment with a z-score of > 2.5 = abnormal
  • <5 mm = small
  • 5 – 8 mm = large
  • ≥8 mm = giant

A recent article by Manlhoit et al. points out the folly of using absolute measurements in this instance. They then take the logical next step by introducing a classification system based on z-scores. Using their previously published data (from Boston, see above), the authors advocate the following coronary artery aneurysm z-score classification:

  • ≥2.5 – <5 = small
  • ≥5 – <10 = large
  • ≥10 =  giant

The clinical science behind establishing these cutoff points is presented in the article and is beyond the scope of what I am trying to do here. However, it is worth noting that (at least to me) the proposed system has a certain elegance and symmetry— it just seems reasonable.

Z-Score Equations

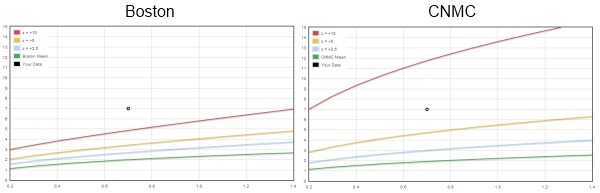
The Boston and CNMC equations each predict very similar values for the BSA adjusted mean diameter by using an allometric model. The two equations also yield similar results out to about z-scores of +2. But the similarities end where coronary artery abnormalities begin. Using the new criteria proposed for giant aneurysms ( z ≥10 ) and applying the CNMC equations, patients who previously had giant aneurysms ( ≥8 mm) now only have large aneurysms.

Boston vs. CNMC coronary artery z-score comparison

(See this page for the interactive comparison)

The big difference between the two z-score equations (z = [score – mean] / standard deviation ) is in how they deal with the standard deviation. The Boston equations use a separate regression (on BSA) to predict the SD, while the CNMC equations use the regression mean square error (MSE) statistic as a substitute for the SD.

Residuals

I have always been bothered by the patent substitution of the regression MSE (usually, the square root of the MSE i.e., the RMSE) for the population SD— particularly for the purpose of calculating z-scores. While the “transform both sides” strategy is perfectly legitimate for stabilizing the variance (and indeed, for discovering the allometric relationship!), if you play around with the regression residuals and then back-transform (i.e., exponentiate) your calculations — you have just modeled positive skew.

Detecting skew shouldn’t be all that hard to do. If the values are distributed normally, then it stands to reason that the residuals (observed - predicted) are also normally distributed. A simple plot of the residuals should show us what is going on. Here is the frequency vs. residuals plot from the recent fetal echo reference values of Lee et al.:

freq_v_resid-Lee 

(Similar residuals plots are provided by the crazy-cool online curve fitting at ZunZun.com.)

That’s not to say that skew doesn’t exist. Indeed, that is part of the point and elegance of the recently applied LMS method. It is imperative that we do something to examine the presence or absence of skew, and then describe how we intended to deal with it. Unfortunately, both of these investigations fail to mention this fundamental data characteristic in their respective manuscripts.

Bottom Line

Due to unexplored assumptions about the nature of the residuals/skew of the data, z-score cutoff values are not universal and are absolutely dependent upon their underlying reference z-score equations.